

How China’s foreign trade keeps defying the odds
July 09, 2026
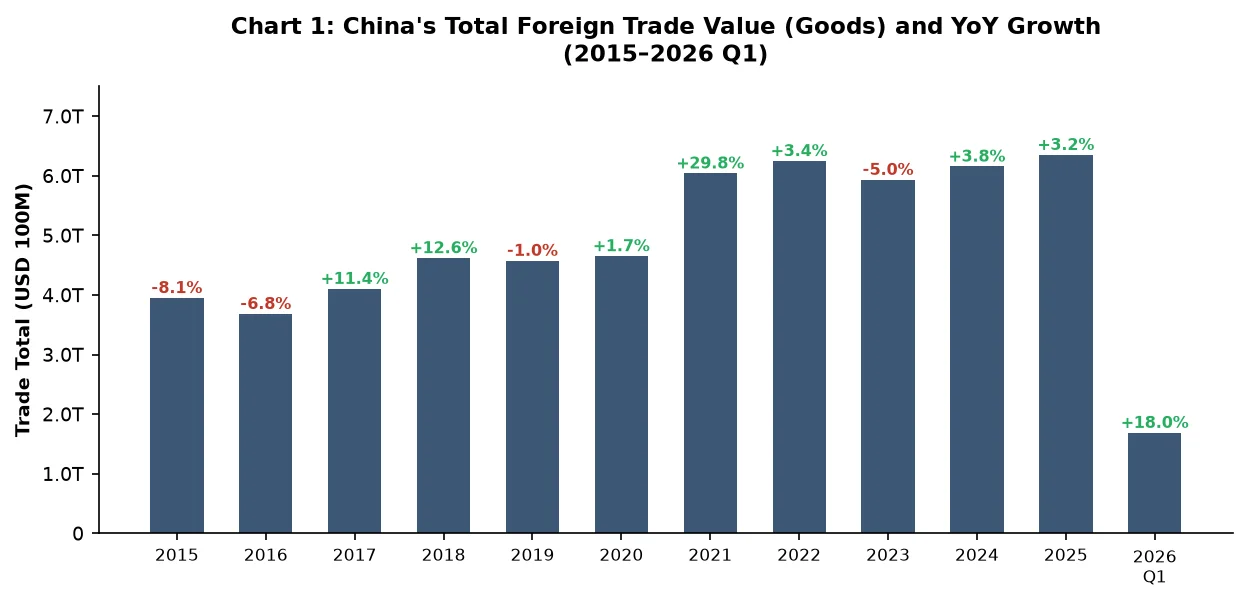
In the first quarter of 2026, as the US-Iran war sent shockwaves through global energy markets and geopolitical fragmentation deepened further, China’s total trade grew 17.96% year-on-year. That number is not a misprint. It is the latest entry in a decade-long pattern that has consistently confounded expectations: China’s foreign trade has not just survived a relentless succession of external shocks — in most years, it has grown through them.
From the trade war of 2018, to the once-in-a-century disruption of COVID-19, to the Red Sea crisis, to successive rounds of tariff escalation, each shock was supposed to be the one that finally broke the momentum. None did. This article examines why — analyzing the structural sources of China’s trade resilience across five dimensions: trade scale, market diversification, export composition, manufacturing fundamentals, and logistics infrastructure.
1. A Decade of Growth Through Shocks
The past ten years of trade data tell a consistent story. Despite persistent deterioration in the external environment, China’s foreign trade has maintained a broadly positive trajectory. When the Sino-US trade war erupted in 2018, trade kept growing. In 2019, total trade dipped just 0.96% — a shallow correction. When COVID-19 caused a sharp global contraction in 2020, China’s total trade still managed 1.7% growth, one of the few major economies in positive territory. With pandemic control better contained and supply chains relatively intact even as Russia invaded Ukraine, trade then surged 29.81% in 2021 and added another 3.43% in 2022 on top of that elevated base.
The only genuine dip came in 2023, when global trade contracted and trade frictions multiplied: China’s total fell 5.04% year-on-year, though it remained 44.53% above 2017 levels. In 2024, despite the Red Sea crisis disrupting shipping lanes and US restrictions intensifying, trade grew 3.76%. In 2025, through another round of tariff escalation, it held broadly stable at +3.17%. Then came Q1 2026: +17.96%, amid active geopolitical conflict and deepening fragmentation.
Source: General Administration of Customs of China; iFind
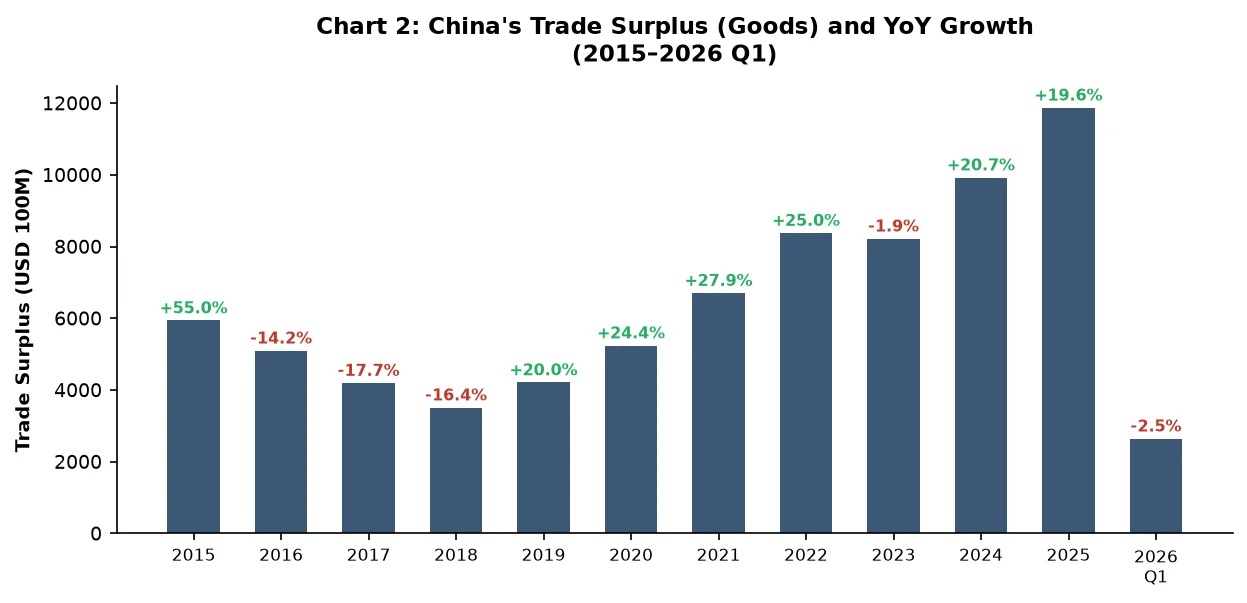
The trade surplus tells a parallel story. From 2015 to 2018 it declined continuously under trade war pressure, hitting a decade low. But in 2019 it rebounded 19.98%, essentially recovering to pre-war levels — demonstrating China’s growing capacity to absorb trade friction. Through the COVID years, China’s supply chain advantages kept exports flowing when others couldn’t, and the surplus climbed year by year.
In 2026, even as the US-Iran war caused severe disruption to global energy supply chains, China’s trade position remained robust: the first-quarter trade surplus reached $264.3 billion.
Source: General Administration of Customs of China; iFind
2. From One Dominant Partner to a Diversified World
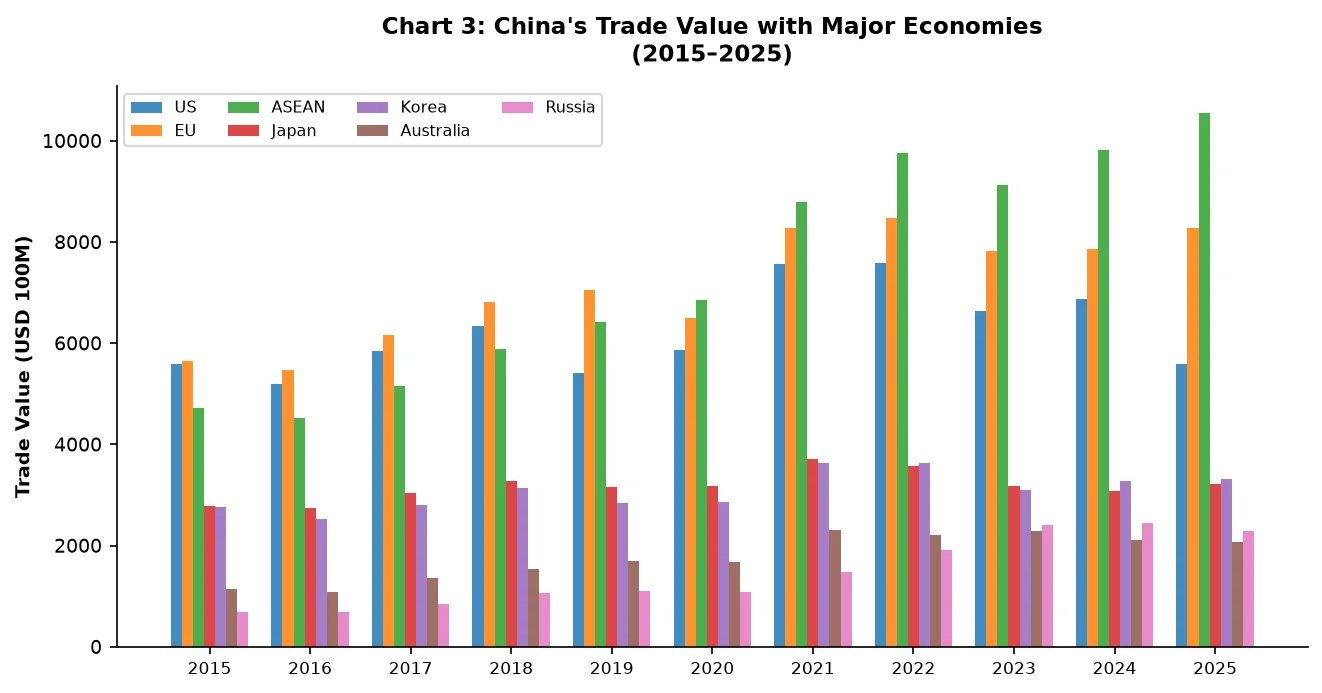
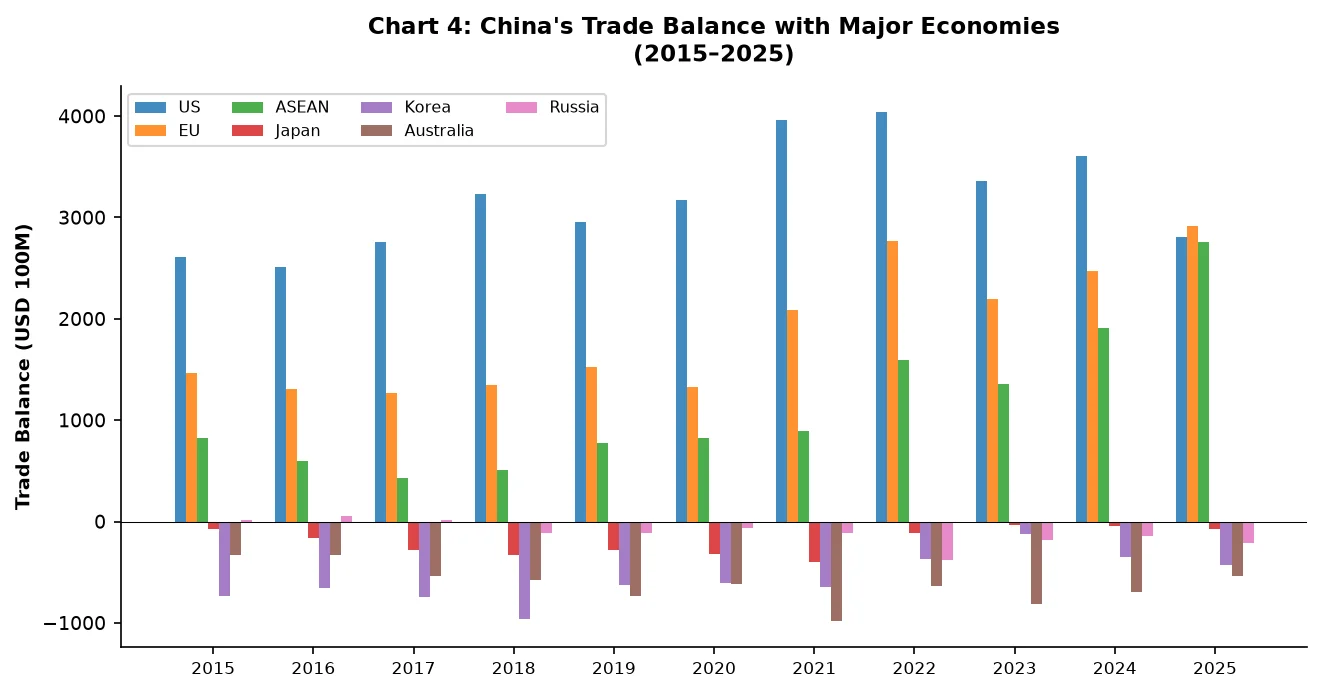
A decade ago, the United States was China’s largest trading partner and primary source of surplus by a wide margin. When the trade war erupted in 2018, China’s surplus with the US still stood at $323.3 billion — far exceeding those with the EU or ASEAN. The ‘China exports, America consumes’ model was the backbone of global trade. But it also left China’s external sector deeply exposed to US policy cycles. That dependence has since been fundamentally restructured.
Source: General Administration of Customs of China; iFind
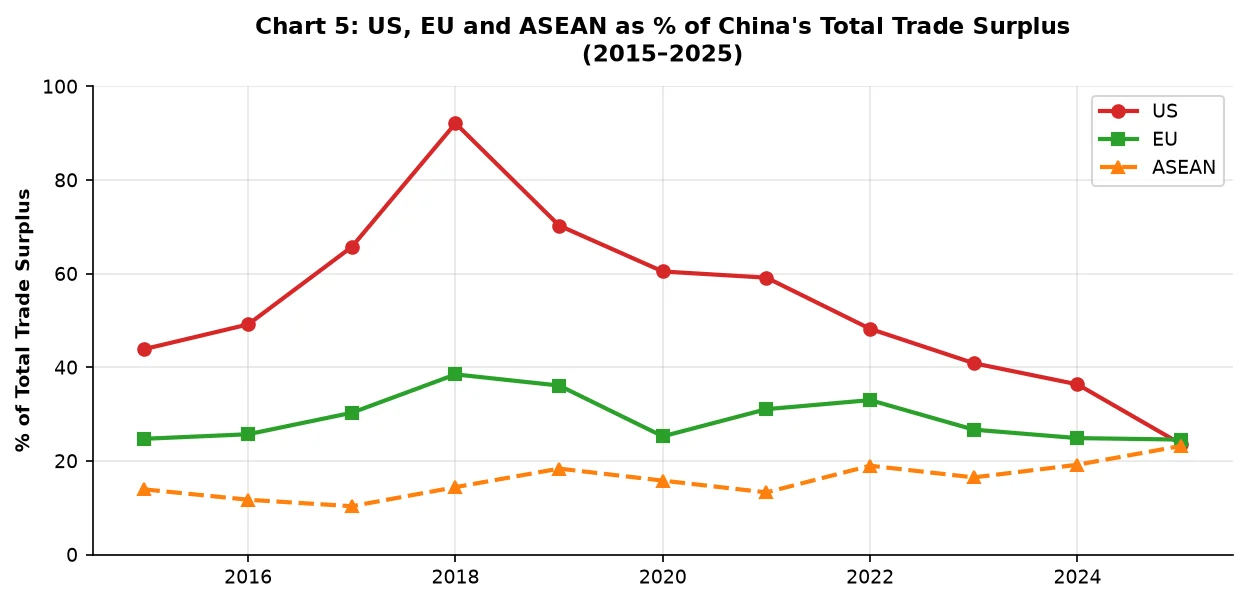
The shift is now unambiguous. In 2025, ASEAN became China’s largest trading partner with $1,056.4 billion in trade — an 8% year-on-year increase — accounting for 16.6% of China’s total foreign trade. The EU ranked second at $828.1 billion (+6%), representing 13.1% of the total. The US, at $559.7 billion, fell to third place with a share of just 8.8% — down from roughly 19% in 2017.
Source: General Administration of Customs of China; iFind
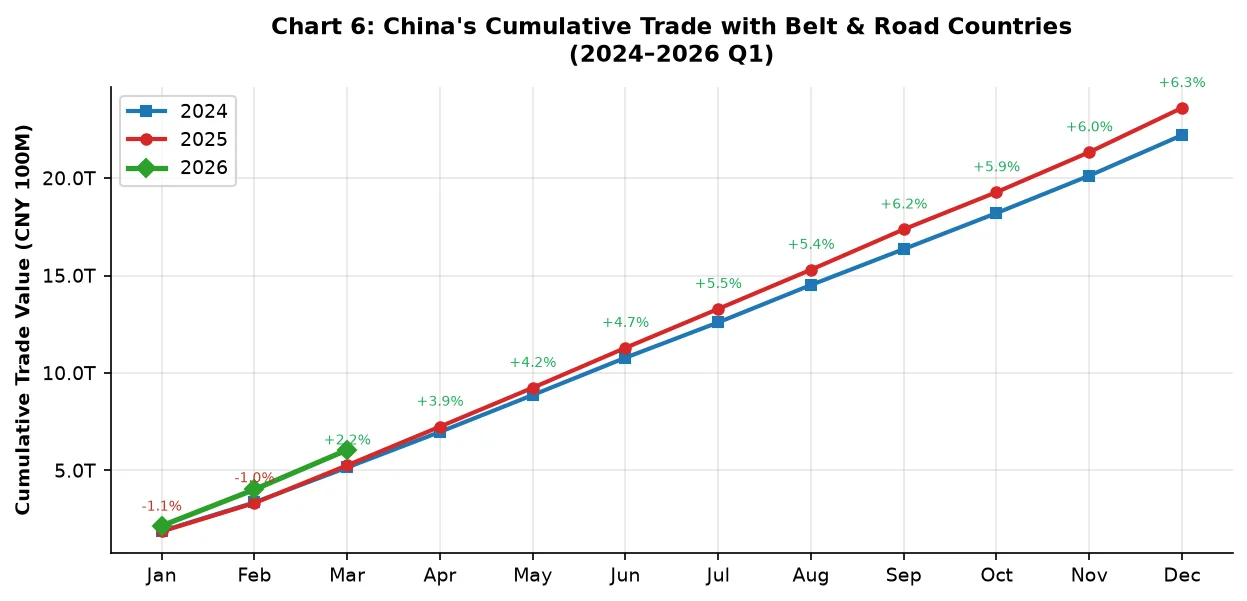
China’s exports to the US fell approximately 20% in 2025. But that shortfall was largely offset by rapid surplus growth elsewhere. Exports to ASEAN grew 13.4% in 2025, then accelerated above 20% in Q1 2026, underpinned by the China-ASEAN FTA 3.0 framework and RCEP. Exports to the EU grew 8.4% in 2025, with Q1 2026 growth again exceeding 20%. And BRI countries now account for more than 50% of China’s total foreign trade.
The diversification extends beyond these headline partners. In Q1 2026, China’s exports to Africa grew 26.3% year-on-year, becoming one of the fastest-growing export engines. The US share of China’s external trade has not been replaced by one market — it has been replaced by many, creating a structurally more resilient, multi-anchor global trading architecture.
Source: General Administration of Customs of China; iFind
This shift was not purely reactive to US pressure. It reflects years of deliberate policy: institutional frameworks like RCEP and FTA 3.0, and the proactive push by Chinese enterprises into emerging markets. What began as a hedge has become a structurally more robust trading architecture — and in 2026, under the stress of active geopolitical conflict, it is proving its worth.
3. From ‘Old Three’ to ‘New Three’: The Upgrading of China’s Exports
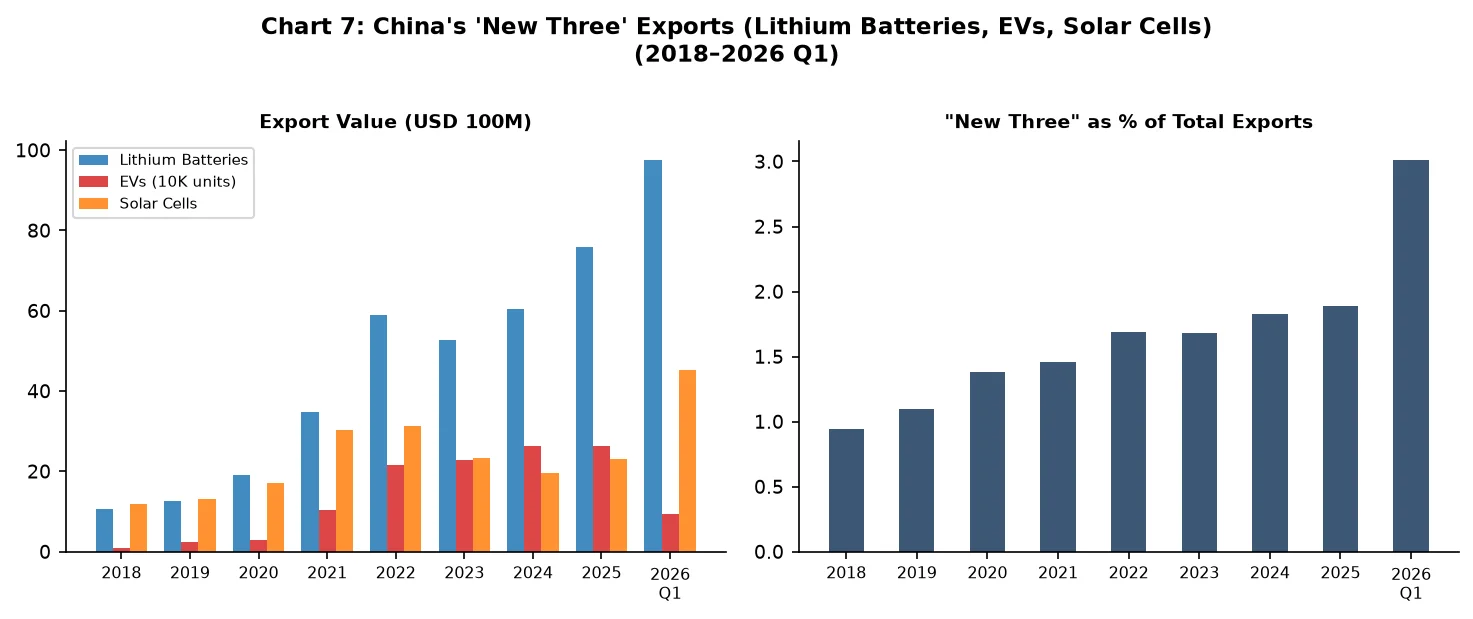
Market diversification absorbs external shocks. But the deeper source of resilience lies in what China is actually exporting. Over the past decade, China’s export composition has undergone a historic shift — from the ‘old three’ (garments, home appliances, furniture) toward the ‘new three’: electric vehicles, lithium-ion batteries, and solar cells. These are products with higher margins, more resilient global demand, and commanding Chinese technological positions.
BRI trade growth has provided the geographic platform for this upgrading. Since the initiative’s launch, trade with BRI countries has grown substantially, diversifying export destinations and reducing dependency on any single market.
Source: iFind
Source: iFind
The Q1 2026 data make the pace of this upgrading concrete. Lithium battery exports reached $23.95 billion, up 54.7% year-on-year. Solar cell exports hit $8.61 billion, up 34.2%. NEV exports totaled 954,000 units — a 120% increase. Chinese brands are gaining market share globally across all three categories, not just in emerging markets but increasingly in Europe.
4. Two Structural Moats: Manufacturing Depth and Logistics Infrastructure
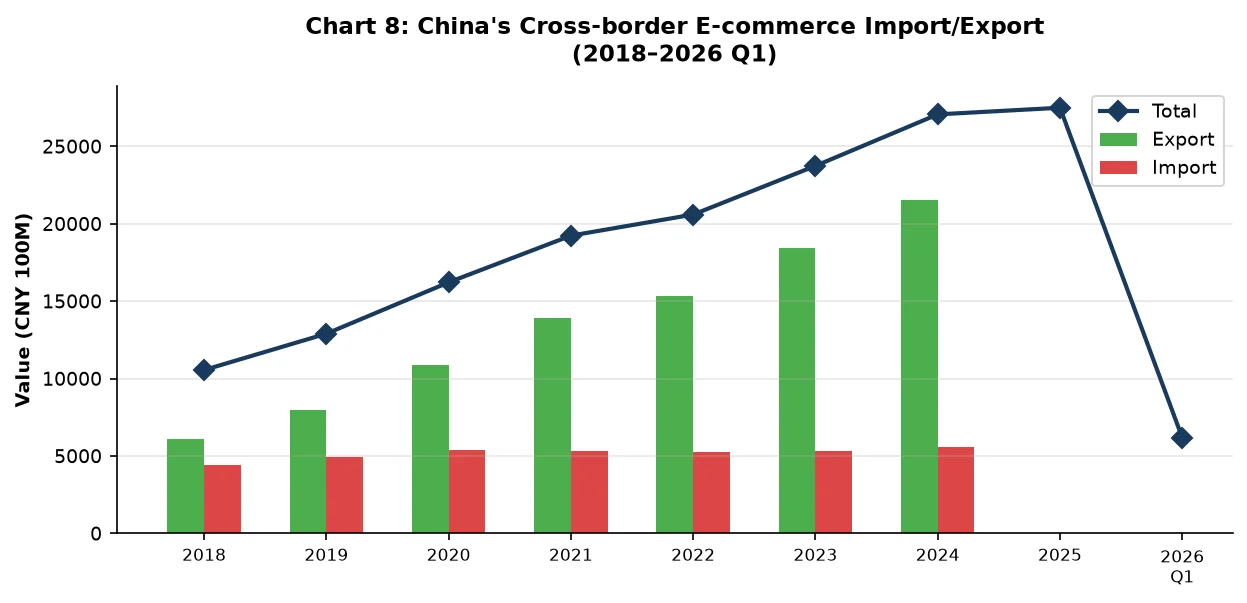
Alongside the ‘new three’, cross-border e-commerce has become one of China’s most significant new trade channels. Platforms like Shein, Temu, and AliExpress have built direct B2C export pipelines, bypassing traditional intermediaries and giving Chinese manufacturers direct access to global consumers. By 2025, cross-border e-commerce imports and exports totaled RMB 2.75 trillion — up 69.7% compared with 2020. The model of small, fast shipments from overseas warehouses allows Chinese firms to respond to consumer demand in near-real time, improving both margins and market intelligence.
Beneath these distribution innovations sit two structural advantages that are genuinely difficult to replicate. The first is manufacturing comprehensiveness. China is the only country that holds all 41 major industrial categories recognized by the United Nations. This completeness confers a supply chain resilience no policy can quickly rebuild elsewhere. The EV sector illustrates it: more than 90% of parts for a Chinese-made electric vehicle can be sourced within a 100-kilometer radius of the assembly plant. That density reduces logistics costs, cuts coordination complexity, and makes the entire system far more shock-resistant. It was precisely this ecosystem that kept China’s exports stable in the early months of COVID-19, when most other manufacturing centers went dark. Scale reinforces the advantage further: for the same electronic product, the marginal cost of production in China is typically 10-20% lower than in Southeast Asia.
Source: General Administration of Customs of China
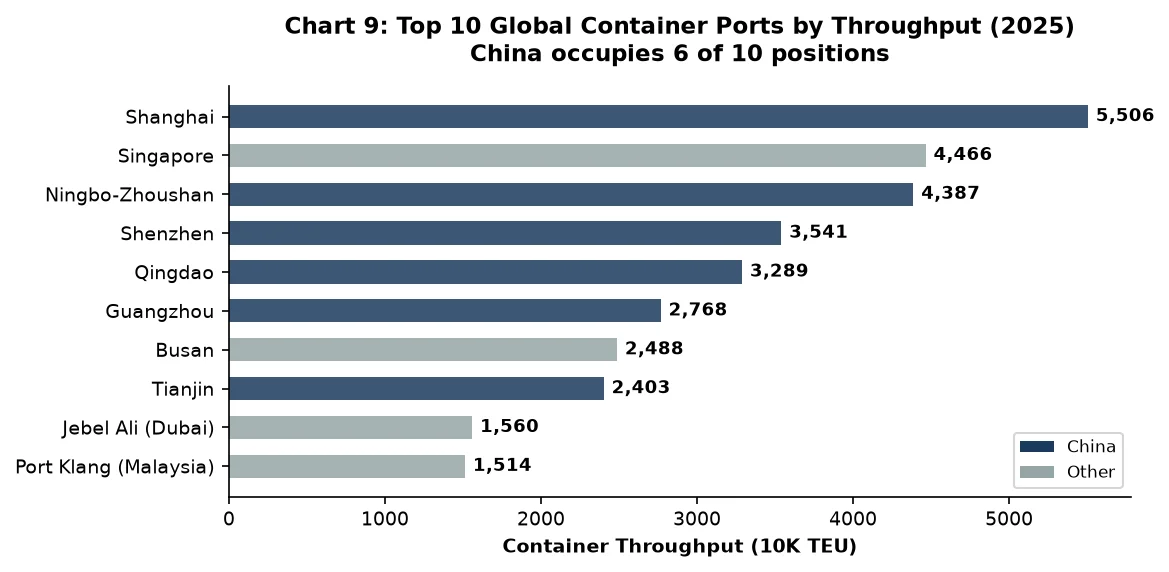
The second moat is logistics. In 2025, six of the world’s top ten container ports by throughput were Chinese — Shanghai (the world’s busiest), Ningbo-Zhoushan, Shenzhen, Qingdao, Guangzhou, and Tianjin, all exceeding 30 million TEUs. These ports are not just high-volume: they are deeply integrated with surrounding manufacturing clusters, creating a ‘port-front, factory-back’ model of exceptional efficiency. And when sea routes come under pressure — as they did with the Red Sea crisis and again with the US-Iran war raising Middle East shipping risks — China has alternatives. The China-Europe Railway Express has now logged over 100,000 cumulative train runs, reaching more than 220 cities across 25 European countries, with transit times roughly two-thirds shorter than sea freight. Chinese companies have also built over 2,500 overseas warehouses globally, enabling fast cross-border delivery at scale.
Source: Compiled from public data
5. Challenges Ahead — and How China Should Respond
China’s foreign trade resilience is real and structural — but honest analysis requires acknowledging its limits. On the external front, EU and US tariffs and anti-subsidy investigations are normalizing, creating sustained headwinds. Global economic slowdown is softening external demand. The acceleration of ‘friend-shoring’ and ‘near-shoring’ is gradually shifting parts of the supply chain to Vietnam, India, and Mexico, creating diversion pressure on traditional Chinese export shares. Internally, China still faces import dependency in certain critical technologies, meaning trade growth in those sectors remains partly hostage to external environment shifts. Addressing these challenges requires a coordinated response across several dimensions:
- Deepen market diversification. Continue expanding into BRI markets, Africa, and Latin America — completing the multi-anchor global trading architecture that has already proven its value under pressure.
- Accelerate export upgrading. Push beyond the ‘New Three’ into a broader range of high-technology, green, and services exports. The structural shift from low-value to high-value products is the most durable source of trade resilience.
- Build autonomous supply chains. Focus on breaking bottleneck technologies, reducing import dependency in critical components, and strengthening supply chain security and self-sufficiency.
- Engage actively in reshaping global trade rules. Advance CPTPP accession negotiations, use institutional openness to consolidate relationships with major trading partners, and reduce pure export-orientation vulnerability through the dual circulation strategy — expanding domestic demand while sustaining global competitiveness.
China’s foreign trade resilience is not accidental. It is the product of market scale, industrial foundations, institutional innovation, and enterprise dynamism working together. In an increasingly fragmented and uncertain global trade environment, the depth of those foundations suggests this resilience is structural — not cyclical. As long as China sustains its commitment to openness, innovation, and structural reform, its foreign trade retains the capacity for stable growth through complexity.
Enjoying what you’re reading?
Article Subscribe (1)
Professor profile

OU-YANG Hui
Dean's Distinguished Chair Professor of Finance and Senior Associate Dean, Cheung Kong Graduate School of Business (CKGSB)
PhD, University of California, Berkeley
PhD, Tulane University





Related Articles



Our Programs

Emerging Tech Management Week: Silicon Valley
Global Unicorn Program Series
In partnership with UC Berkeley College of Engineering
A technology management program for leaders looking to turn emerging technologies into business opportunities.
Combining proven strategies and cutting-edge research, the program helps participants fuel innovation, seize opportunities in emerging technologies, and catalyze transformation within their organizations. Designed for managers, start-up leaders, and technology investors, it includes visits to venture capital firms and technology companies, alongside mentored group projects.
LocationUC Berkeley, California, United States
Date01 - 06 Nov, 2026
LanguageEnglish

Asia Start: AI + Digital China Expedition
An immersive program for entrepreneurs and executives looking to understand China's AI and digital economy firsthand.
Gain the latest trends and insights, strategies, and connections to overcome challenges and support future business growth in Asia and beyond.
LocationChina (Beijing, Shanghai, Hangzhou & optional Shenzhen)
DateNovember 2–7, 2026 | April 19–24, 2027
LanguageEnglish

Intelligent China: AI, EVs & Smart Manufacturing
A three-part program examining China’s advances in AI, electric vehicles, and smart manufacturing.
Through faculty-led sessions, company visits, and exchanges with industry leaders, gain practical insights for your organization's strategy, partnerships, and investment decisions. Join an individual four-day program or complete the full 12-day series.
LocationBeijing, Shenzhen, Shanghai, and Hangzhou
Date December 2026 – July 2027 (three 4-day programs)
LanguageEnglish

Emerging Markets: Innovation and Scaling for Exponential Growth – ASEAN
A China-focused innovation program for ASEAN executives and business owners responding to the impact of AI on their industries.
Gain insights from leading Chese thinkers in Jakarta, with an optional immersion in China and opportunities to connect with the business leaders driving innovation. The program offers a closer look at how developments in China could affect your industry and business.
LocationJakarta, Indonesia
Date2–4 December 2026
LanguageEnglish (with Chinese translation)

Stanford & Silicon Valley Immersion Program
Global Unicorn Program Series
In partnership with Stanford Engineering Center for Global & Online Education
A Silicon Valley immersion for entrepreneurs, intrapreneurs, and investors leading and scaling AI-driven companies.
The program combines academic learning with visits to AI and robotics labs and Silicon Valley companies, giving participants direct exposure to emerging technologies and the businesses developing and applying them.
LocationStanford University Campus, California, United States
Date06 - 11 Dec, 2026
LanguageEnglish with Chinese Translation