

This survey was led by Dr. Zhang Xiaomeng, Associate Professor of Organizational Behavior, Associate Dean for Executive Education and Co-Director of the Leadership and Motivation Research Centre at the Cheung Kong Graduate School of Business (CKGSB).
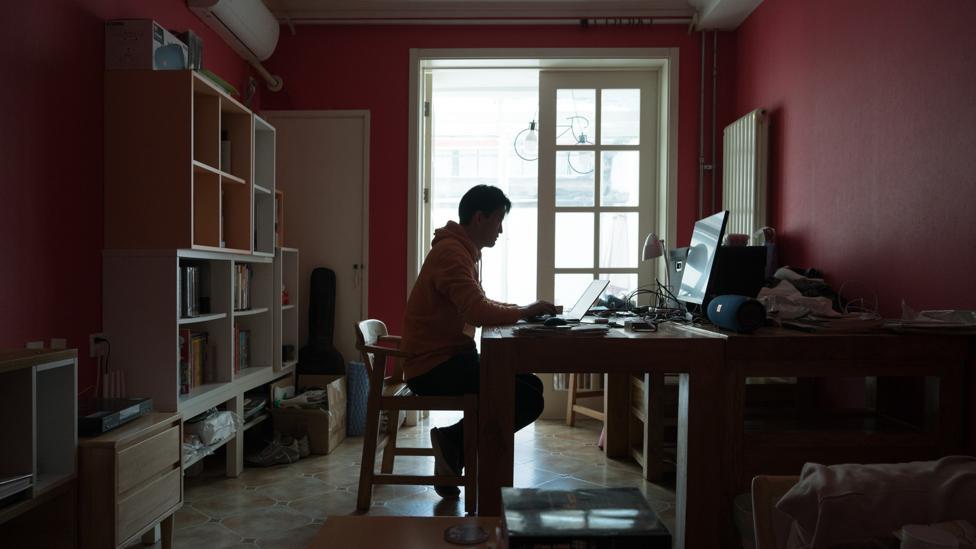
The COVID-19 pandemic has forced us to press pause on the Chinese economy, with companies now facing challenges on the issues of production and employment resumption. Now more than ever, it is vital that we work together to recover from losses while remaining vigilant to ongoing risks. Individual psychological resilience has a strong bearing on corporate resilience and the time it takes for the Chinese economy to bounce back. Whilst it goes without saying that a strong rebound is essential, the issue now is how to resume production and employment whilst ensuring risk is kept at bay.
This is part five of the survey series, examining factors affecting stress and how low levels of loyalty should be closely followed.
Overall conclusions
There are wide disparities between respondents with high and low resilience in terms of distribution and resilience-related factors. We indexed the most important indicators such as gender, seniority and industry to generate a “recovery index”. We conducted a multi-dimensional comparative analysis of more than 9,000 valid responses to which we hope will help inspire individuals and organizations to develop targeted psychological resilience measures and accelerate recovery.
1. More men than women are highly resilient; more women than men have lower levels of resilience. As age, seniority and working years increase, resilience tends to be higher.
2. Small companies’ staff are less resilient. Those with fewer than 100 employees and an annual revenue of less than RMB 10 million have the smallest proportion of highly resilient staff and the highest proportion of staff with low levels of resilience.
3. The three sectors with most resilient staff are: energy/mining/environment (24.68%), real estate (21.71%), and services (21.66%).
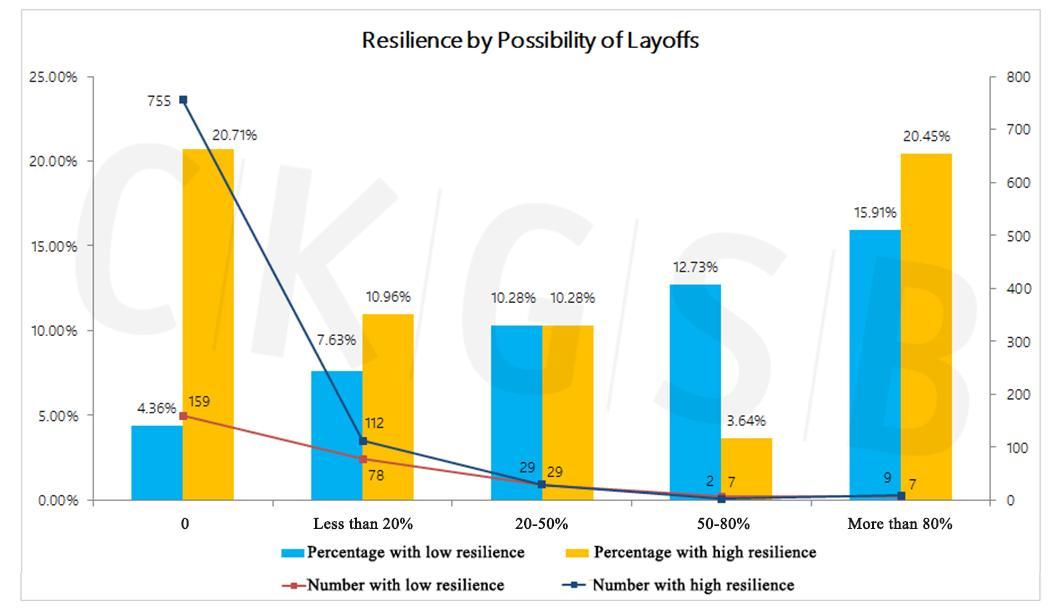
4. As for layoffs and pay cuts, the largest proportion of highly resilient respondents are those who felt confident they would keep their jobs, or even receive a pay rise. At the same time, among respondents who felt they had an 80% or more chance of losing their job, or having a 50% or more pay cut due to the epidemic, many still remained resilient.
5. With greater engagement in sports and conversing with family and friends, came higher resilience levels among respondents.
6. The recovery index (indicating the difference between positive and negative indicators affecting psychological condition, see below for details) of the overall sample is 49.95. The recovery index of people with high resilience (65.41) is significantly higher than that of people with low resilience (21.65).
7. From the perspective of gender and seniority, the highest scores in the recovery index are found among male and female company leaders (54.94 and 54.29 respectively) while the lowest scores are among female junior managers and employees (46.60 and 46.87 respectively). The recovery index shows an upward trend as the rank of the respondents increased. Female respondents scored slightly lower in terms of the recovery index than male respondents of the same seniority level.
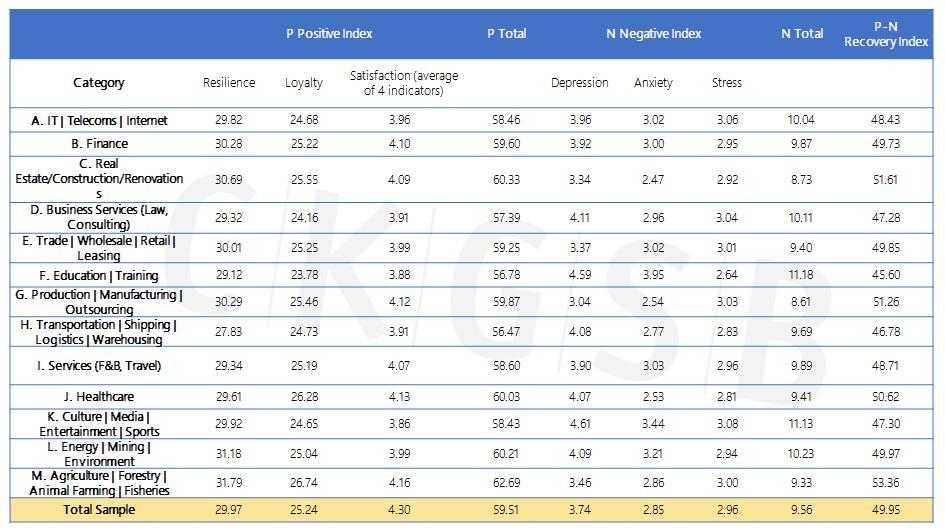
8. From an industry perspective, the three industries with the highest recovery index scores are: agriculture/forestry/farming/fishing (53.36), real estate (51.61), and production/manufacturing/outsourcing (51.26). The three with the lowest recovery index scores are: business services (47.28), transportation/shipping/logistics/warehousing (46.78), and education/training (45.60).
9. Regarding “top wish after the epidemic”, 4,662 valid answers were compiled, categorized and analyzed. The two largest categories chosen are outdoor activities and travel (1,178 responses, or 25.27%) and work (960 responses, or 20.59%).
10. Regarding “biggest take-ways and areas of growth” of the 4,446 valid answers received, the two categories with most answers are cherishing life and health (962 answers, or 21.62%) and spending time with the family (643 answers, or 14.45%)
Distribution and differences between high and low psychological resilience groups
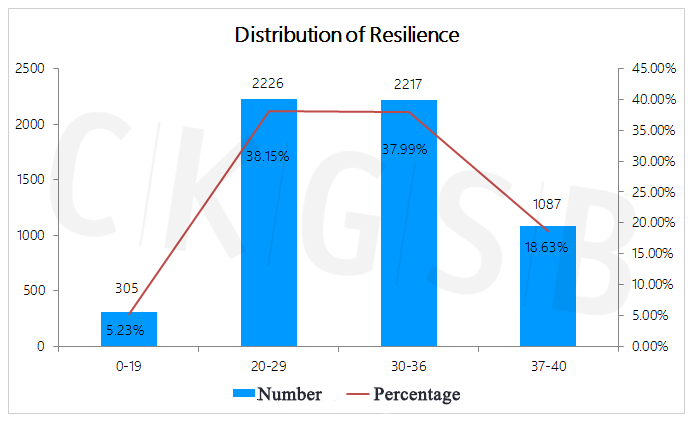
The psychological resilience range of our survey was from 0-40, with low resilience set at 0-19, average resilience at 20-29, higher than average resilience at 30-36 and extremely high resilience at 37-40. In order to more intuitively compare differences between high and low resilience groups in terms of recovery potential, we made a comparison between the group of respondents with resilience scores between 0-19 (305 respondents, referred to in this report as the low resilience group) and those scoring between 37-40 (1,087 respondents, referred to in this report as the high resilience group).
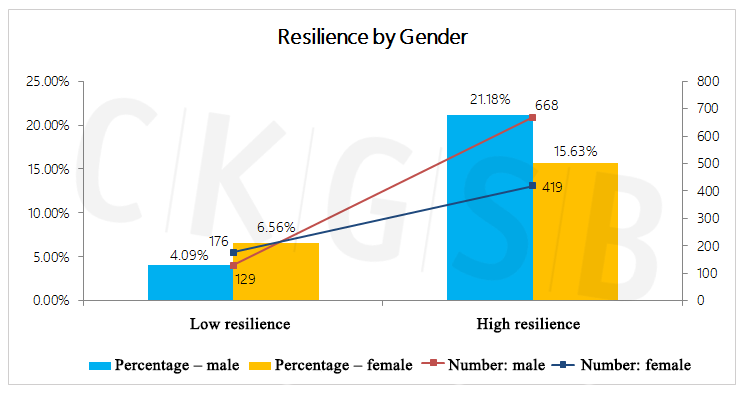
1. Gender difference: in terms of the overall sample, resilience was found to be higher among male than female respondents. 4.09% of male respondents were in the low resilience category, compared to 6.56% of women. 21.18% of male respondents were categorized as highly resilient, in contrast with 15.63% of female respondents.
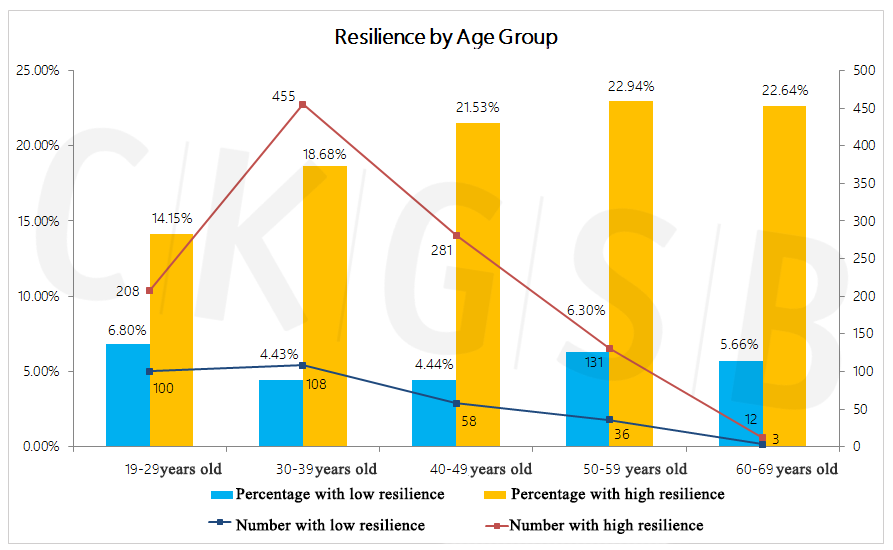
2. By age group: the highest proportion of respondents in the low resilience group (6.80%) were the 19-29 age group. By contrast, the highest proportion of those in the high resilience group (22.94%) were the 50-59 age group. With age, psychological resilience is shown to increase.
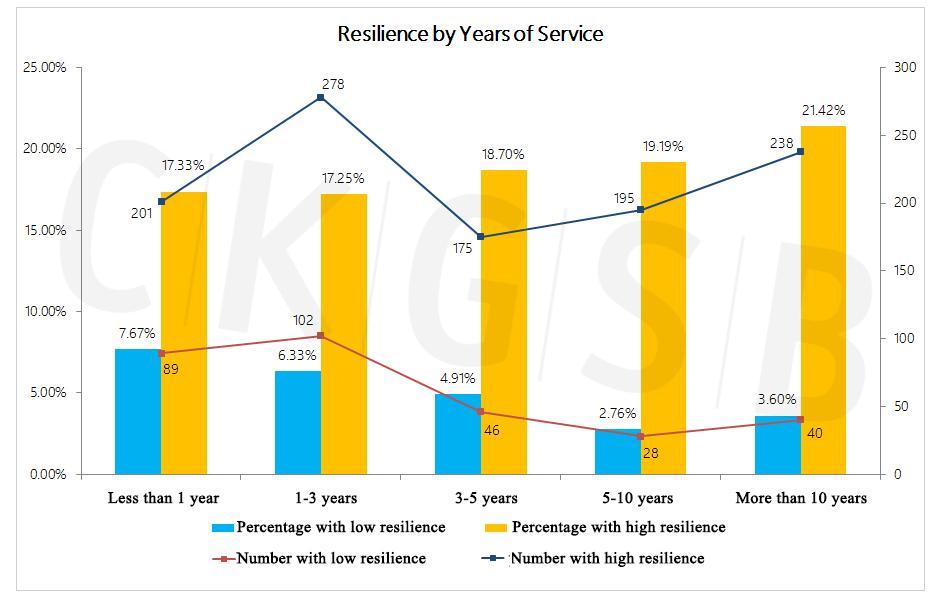
3. Working time: most low resilience respondents (7.67%) were found in the group of respondents who worked in their company for less than one year. Most high resilience respondents (21.42%) had served their company for 10 or more years. As working years increase, respondents tend to have higher resilience.
4. Seniority: the leaders group has the highest proportion of respondents with high resilience (22.90%) and the employees group has the most respondents with low resilience (7.94%). As seniority increases, respondents tend to have higher resilience.
![]()
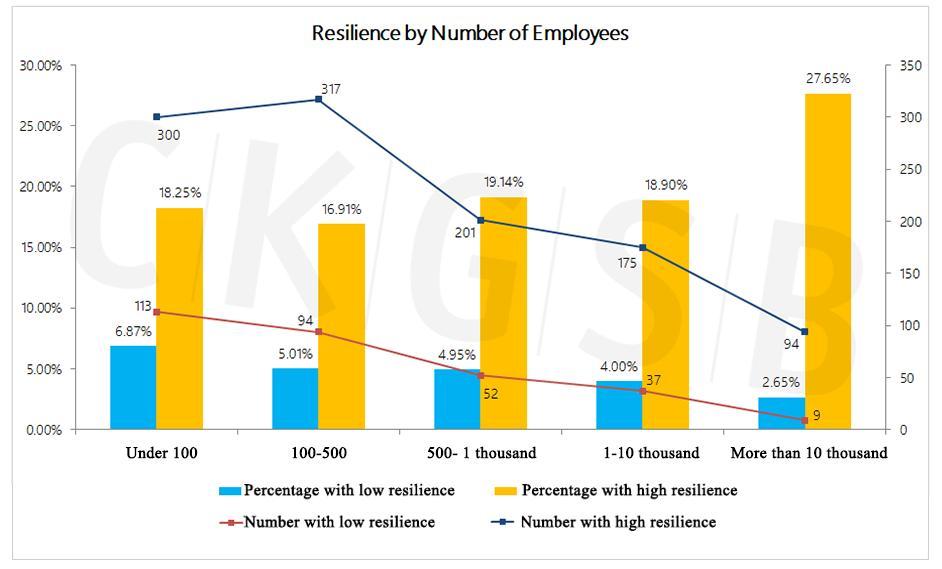
5. Company size: from the perspective of company size, the highest proportion of respondents in the high resilience group were those in companies with more than 10,000 staff (27.65%), and the highest proportion of respondents in the low resilience groups were those in companies with fewer than 100 people (6.87%).
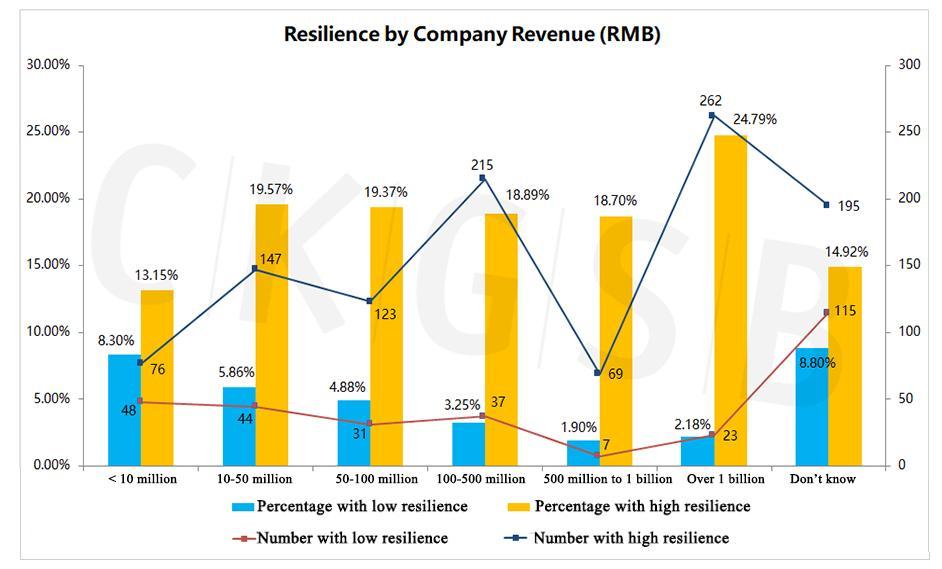
Analyzing company revenue, most high resilience respondents worked for companies with annual revenues of more than RMB 1 billion, whilst most low resilience respondents were not even sure how much their company made in a year (8.80%), followed by those working for companies earning less than RMB 10 million (8.30%). Enterprises with fewer than 100 employees and an annual revenue of less than 10 million have the lowest proportion of high resilience staff.
6. By industry: the industries with the most high resilience respondents were energy/mining/environment (24.68%), real estate (21.71%), and services (21.66%). The industries with most low resilience respondents were transportation/shipping/logistics/warehousing (10.42%), services (7.86%), education/training (7.01%). From this we see that psychological resilience among service sector workers presents a polarized distribution.
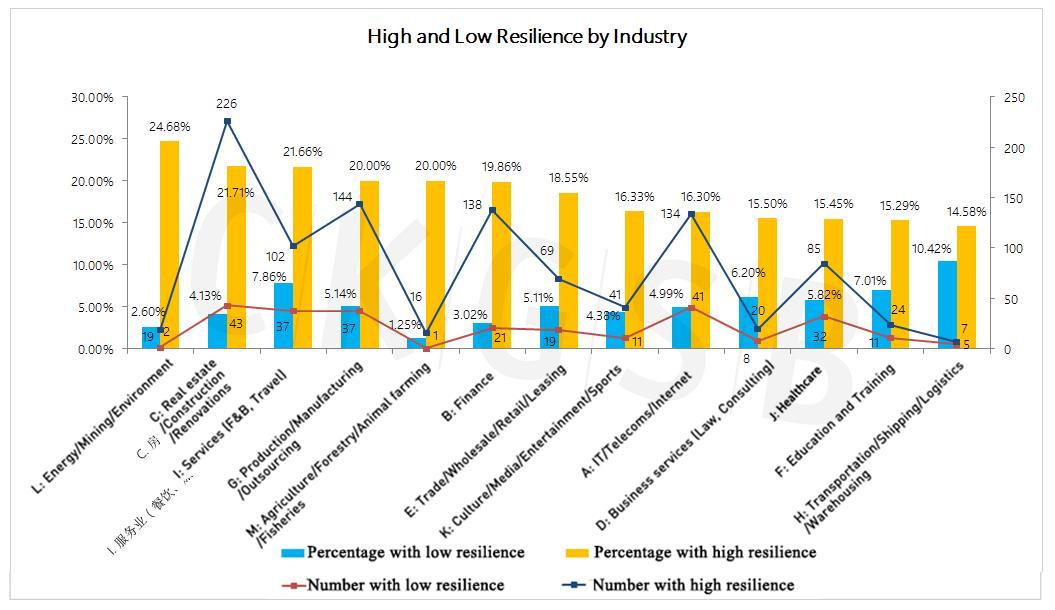
* Note: The number of respondents in business services, energy/mining/environment, agriculture/forestry/farming/fishing, and transportation/shipping/logistics/warehousing was relatively low, resulting in a possible data deviation.
7. The possibility of being laid off or receiving a pay cut: the largest proportion of respondents with high resilience was found in respondents who did not believe that they would be laid off (20.71%). This ratio of highly resilient respondents was lower in those who believed that they were more likely to be laid off. But for those who believed that they had an 80% or greater chance of being laid off, resilience increased (20.45%), whilst among these respondents, the proportion of low resilience respondents was also the highest (15.91%). It shows that where layoffs were relatively certain, the distribution of resilience is polarized. Some respondents’ resilience level was not found to be correlated with the possibility of being laid off. However, because the low number of respondents who believed their chance of being laid off was 50% or higher, the data includes biases.
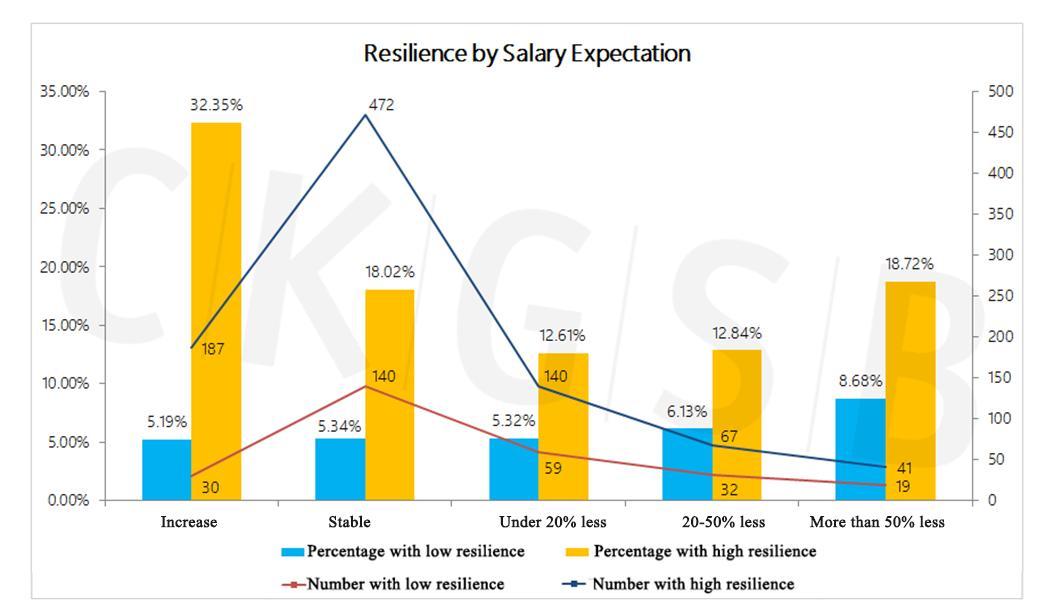
From the perspective of compensation, the highest proportion of people with high resilience were those who believed that their salary and bonuses would rise (32.35%). The highest proportion of people with low resilience were those who expected their income to fall by more than 50% (8.68 %) and the proportion of highly resilient respondents in this group was also relatively high (18.72%), indicating that with clear expectations of pay cuts, some may maintain high levels of resilience.
 * Note: Leaders did not need to answer this question, with the total sample number reflecting this.
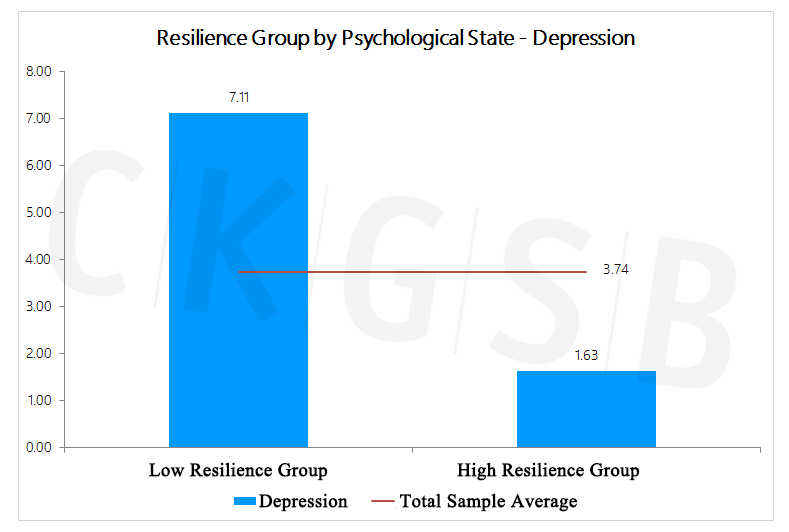
8. A comparison of psychological condition: from the perspective of depression, the average incidence of depression among respondents in the high resilience group was 1.63, and 7.11 among those in the low resilience group (the average depression score for the whole sample was 3.74, on a range of 0-27). From the perspective of anxiety, the average incidence among the high resilience sample was 1.32, and 5.82 among the low resilience sample (the average for the whole sample was 2.85, on a range of 0-21). The lower the scores for depression and anxiety, the lower the possibility of depression and anxiety. Average depression and anxiety scores for those in the high and low resilience groups were within normal range.

9. Loyalty: respondents in the high resilience group scored significantly higher in terms of loyalty (27.68) than those in the low resilience group (20.63).
From the perspective of potential job switching, samples from the high and low resilience groups were compared. The results show that more high resilience respondents said they were unlikely to switch jobs than low resilience respondents. Nearly 90% (87.88%) of respondents who said they would definitely not consider changing jobs were in the high resilience group. Among those who reported they would definitely seek to switch jobs, a majority of them (58.70%) were in the low resilience group.

* Note: Leaders did not have to answer this question, with the total sample number reflecting this.
10. Stress management: from the perspective of stress, the highest proportion in the low stress segment were respondents with high resilience (37.14%). For those who were highly stressed, most respondents (12.19%) were in the low resilience group (12.19%). Among highly stressed respondents, 19.38% were in the high resilience group, indicating that these highly stressed people may be strongly resilient under stress.

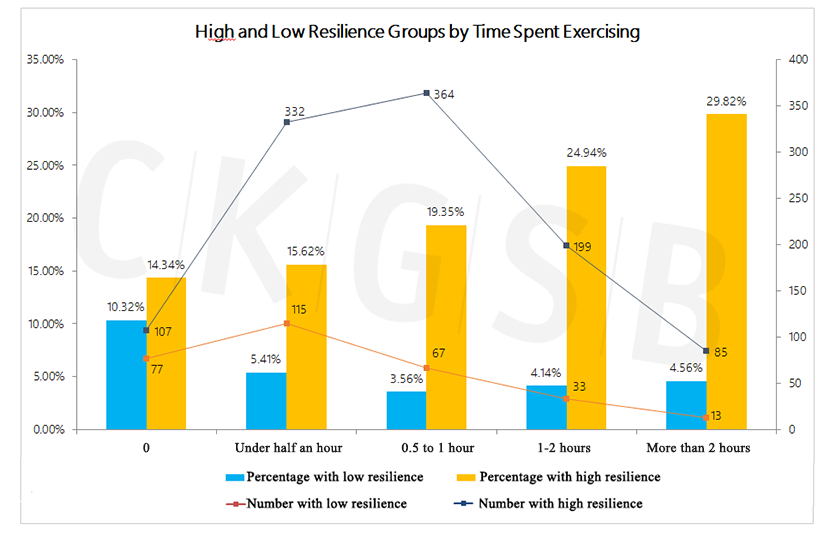
Considering length of time spent exercising, the highest proportion of high resilience respondents exercised for more than two hours and the highest proportion of low resilience respondents did not exercise at all (10.32%). The trend is that the longer the duration of exercise, the percentage of high resilience respondents increases.
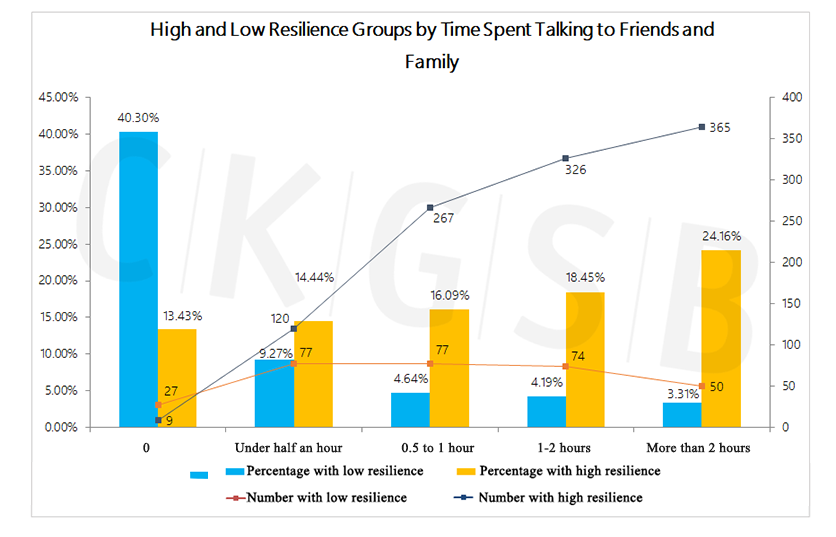
As for the length of time communicating with family and friends, most respondents (40.30%) were found to have low resilience in the group who did not do so at all. With increased communication time, the proportion of highly resilient respondents increased. The highest proportion of respondents with high resilience (24.16%) was found among those who communicated with friends and family for more than two hours a day.
Recovery index: we named our positive indicator P and negative indicator N. The higher the P indicator, the more positive the impact on psychological condition and the higher the N indicator the greater the negative impact on psychological condition. Positive indicators are based on respondents’ resilience, loyalty and satisfaction. Negative indicators are based on respondents’ depression, anxiety and stress. It can be seen that the P indicator of respondents with high resilience reached 71.06, much higher than those with low resilience (37.85). At the same time, the N indicator (16.2) of the low resilience group was much higher than for the high resilience group (5.65). We use the P-N difference to develop the recovery index: the high resilience group’s recovery score (65.41) was much higher than the low resilience group’s recovery score of 21.65. The overall recovery index of the full sample scored 49.95.
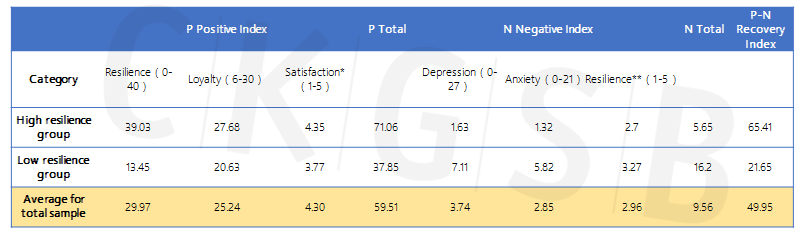
*Satisfaction is the average value of the four indexed factors—satisfaction with epidemic prevention measures, employee care packages, communication with colleagues and job status, ranging from 1 to 5. The higher the score, the greater the level of satisfaction.
** According to earlier research, moderate stress is the most beneficial to mental state. However, in the context of the epidemic, stress was taken as an altogether negative indicator.
Review of important indicators – Seniority x gender
Seniority and gender are important dimensions of this survey and analysis. We have grouped the entire sample according to seniority x gender so as to calculate our recovery index. As shown in the table below, of the 10 groups, male and female leaders scored highest in terms of the recovery index (54.94 and 54.29 respectively), while female junior managers and female employees scored lowest (46.60 and 46.87 respectively).
Reviewing gender differences in our results, female leaders have higher resilience levels than male leaders, but their levels of depression, anxiety and stress are higher than those of male leaders, suggesting they face greater challenges in returning to work post COVID-19.
* For a detailed analysis of the gender dimension, see Episode 2: Gender Differences.
Having said that, recovery index scores increase with seniority. Female respondents of all levels scored slightly lower than males of the same level.
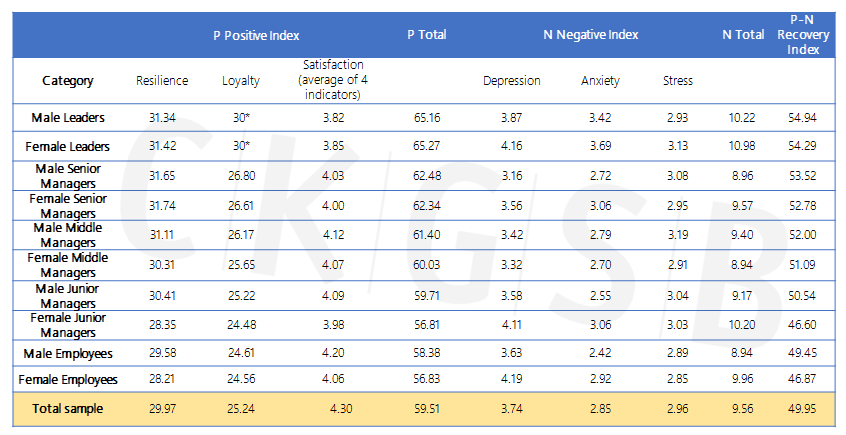
* Leaders did not have to answer the question on loyalty, so we have given both male and female leaders a score of 30 for the sake of the recovery index.
Review of important indicators – industry
From an industry perspective, the three industries with the highest recovery indices were: agriculture/forestry/farming/fishing (53.36), real estate (51.61), and production/manufacturing/outsourcing (51.26). The three industries with the lowest recovery scores were: education/training (45.60), transportation/shipping/logistics/warehousing (46.78), and business services (47.28).
The COVID-19 epidemic – an important lesson in resilience
1. Top wish after the outbreak
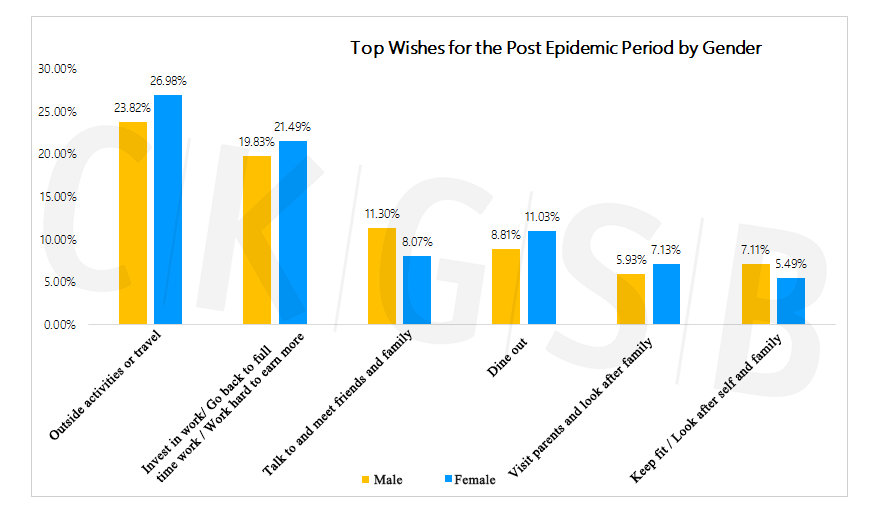
We asked survey respondents, “What is your top wish when the epidemic is over?” and received 4.662 valid responses in total. These were summarized and split into 22 categories, of which 1,178 answers were related to outdoor activities or tourism, accounting for 25.27%, and working accounted for 20.59% or 960 answers, comprising the two largest categories. Other answers included gathering with relatives and friends and eating out (458 answers, 9.82%), visiting parents (302 answers, 6.48%) and sports (297 answers, 6.37%). According to word frequency statistics, the three most frequent words used were work (562), travel (498), and family (279).

From the perspective of gender, in the top six categories, more male than female respondents wrote: meeting friends and family and engaging in sports. As for the four other categories, women predominated over men.
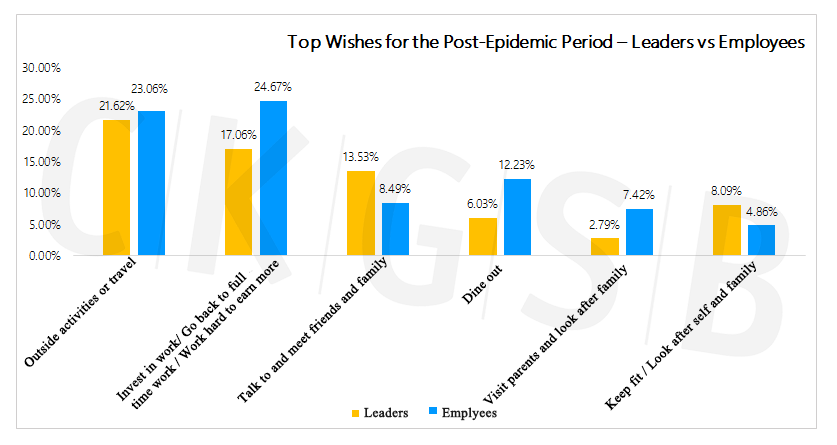
From the perspective of seniority, leaders were compared with ordinary employees. Among the top six categories, employees’ responses falling into the work category were significantly more than those of leaders (24.67% and 17.06% respectively). In the traveling, eating out and visiting parents and relatives categories, employees responded in a greater number than leaders.
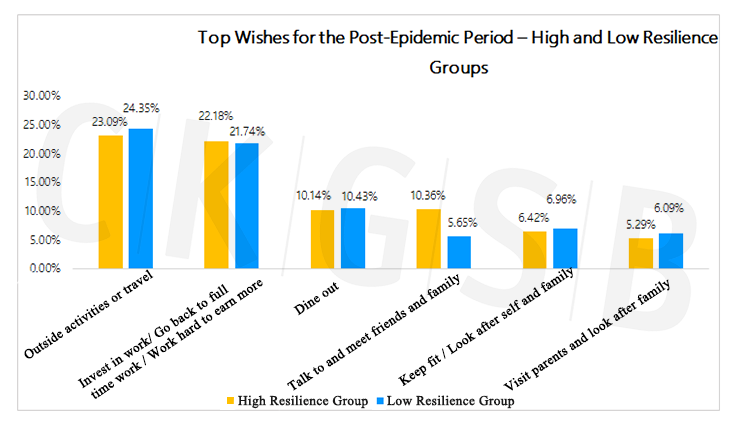
Significantly more respondents in the high resilience group than the low resilience group responded with meeting friends (10.36% and 5.65% respectively), while there were no major differences in other categories.
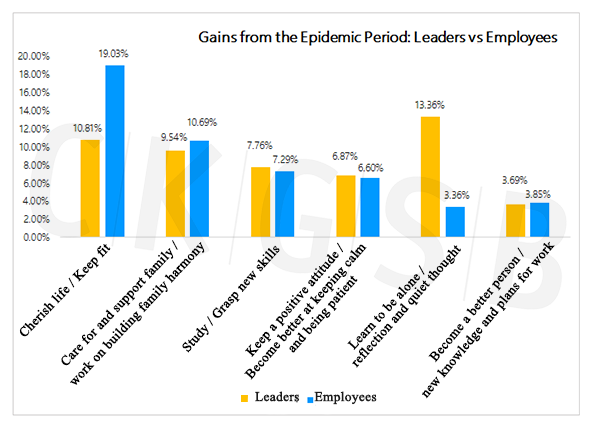
2. The biggest gains and growth points from the outbreak
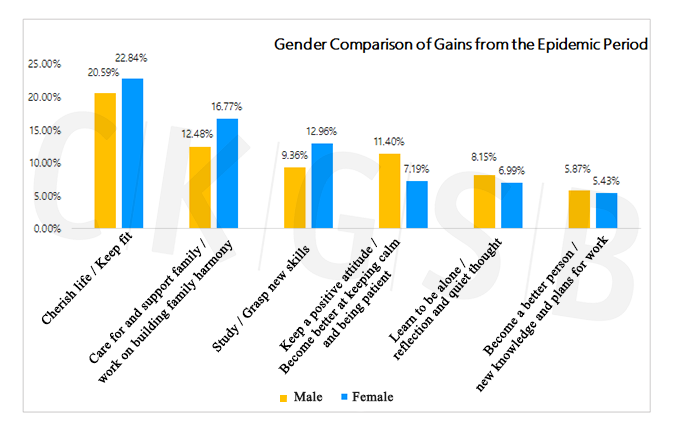
We asked survey respondents to record their “what they have learned and gained from this experience,” and received 4,449 valid answers. These were summarized and filtered into 19 categories. The largest category was cherishing life and health (962 answers, 21.62%), followed by spending time with families (643 answers, 14.45%), learning new skills (490 answers, 11.01%), keeping up a good attitude (421 answers, 9.46%), learning to be alone (339 answers, 7.62%) and gaining new knowledge (252 answers, 5.66%).

Comparing men and women, more women than men responded with cherishing life, caring for family members, and learning. More men than women responded with keeping up a good attitude, learning to be alone, and gaining new knowledge.
Comparing senior leaders and employees, more employees responded with cherishing life and health (19.03%, and 10.81% respectively), and more senior leaders responded with learning to be alone (13.36% and 3.36% respectively). There was little difference in other categories.
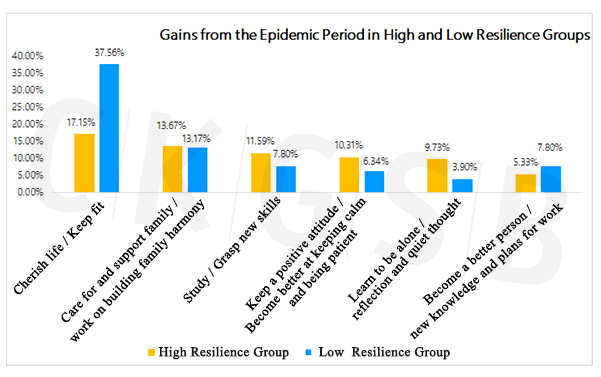
Comparing high and low resilience groups, more respondents in the low resilience group answered cherishing life and health than in the high resilience group (37.56% and 17.15% respectively). More highly resilient respondents answered learning new skills, learning to be alone and keeping up a positive attitude than those in the low resilience group.
Conclusions
This episode considers the distribution and differences between high and low resilience groups, starting with a review of factors that impact personal resilience. These factors include gender, age, seniority, size of company, industry, compensation expectations, psychological state and stress management. We hope that by presenting the results of our analysis, we may assist individuals and companies in their efforts to improve levels of resilience in a more targeted way. For example, we found that length of time engaging in sports and communicating with friends and family was positively correlated with high resilience. More respondents with high resilience than those with low resilience answered that their biggest gains and growth points from the epidemic were learning, learning to be alone and keeping up a positive attitude. Whether for personal time management or in developing corporate care packages and training, everyone can find something of use in such findings.
We reviewed and indexed the important indicators of personal psychological conditions to generate a “recovery index”, which quantitatively presented recovery scores from the angles of gender, seniority and industry. At the intersection of gender and seniority, we found that female respondents had slightly lower recovery scores than men of the same level, but that as seniority increased, so did the recovery index. Taking industry as a denominator, the recovery index score reflected the impact of the epidemic on the mental state of respondents in various sectors, predicting prospects of psychological recovery. No matter how high or low one’s score, companies should care about the mental condition of their employees, give team resilience plenty of attention, and lay a solid foundation for a performance recovery in the near future.
Regarding “biggest wishes for the end of the epidemic” and “learning and growth points”, we conducted a multi-dimensional comparative analysis of 4,662 and 4,449 valid responses, respectively. The results show that: social alienation from epidemic-prevention measures has led to a yearning for communication and relationship-building. The most frequent themes were gathering, family, and communication. Company care packages for employees should promote greater frequency and depth of team communication. Corporate cultural activities may be carried out around the themes of family and care.
Five thematic reports from the survey “Psychological Resilience Before and After Work Resumption during COVID-19” series have now been completed. “Episode #1: Tracking Work Resumption” laid out the status of companies and individuals before and after the resumption of work. “Episode #2: Resuming Work: Gender Differences” revealed similarities and differences between male and female leaders, managers and employees. “Episode #3: Building Organizational Resilience” explored multiple factors that impact the level of resilience. “Episode #4: Stress Management” analyzed stressors, stress management and links to company loyalty. This episode— “Episode #5: Accelerating the Recovery” —presents high and low resilience groups in an exploration of prospects for business and psychological recovery.
We believe that in unprecedented times, the psychological recovery of employees and the reunion of teams are important challenges that companies in all industries face in the period after the immediate threat of the virus has subsided. Reviewing conclusions from our analysis of the entire survey, we summarize our recommendations as follows:
1. Small and medium-sized enterprises have suffered most from this epidemic. Both entrepreneurs and employees of small and medium-sized enterprises show low psychological resilience levels and very high degrees of depression and anxiety. Small and medium-sized enterprises should be flexible and take advantage of their relatively flat organizational structure. Top leaders and executives need to communicate frankly with employees, express concern proactively, recoup confidence, and accumulate energy for recovery.
2. The choices and methods of work resumption by companies and the individual’s working state have a great influence on mental state. Pay cuts and layoffs should be kept to a minimum, and staff should be given clear and stable expectations. In addition to the challenges from the epidemic itself, work and family and unclear strategic direction are important stress factors. Enterprises should promptly clarify future performance goals and strategic direction adjustments to employees, spending as much energy at the top as at the bottom of their organization. Giving employees honest expectations will help them improve their sense of control.
3. Enterprises should particularly pay attention to and care for the mental state of female, young, new, and junior staff. The survey shows that, compared with other groups, these types of employees have relatively lower levels of resilience, and very high levels of depression, anxiety and stress. Activating the leading role of high resilience groups in an organization will help to enhance the overall company resilience. Companies can, for example, empower older employees and executives (especially female executives) to communicate with other low-resilience groups.
4. Corporate leaders and executives face a greater leadership test during the epidemic, and play a crucial role for their colleagues. In the view of most respondents, “leaders and executives personally taking charge of morale-boosting” is more effective than online and offline trainings. In the face of considerable stress, female leaders and executives show a higher level of psychological resilience than their male peers, which is essential to enhancing the resilience of the entire organization. Therefore, companies should pay more attention to, tap and stimulate the advantages of female leadership, and promote the complementary integration of the advantages of gender leadership.
5. With COVID-19 turning into a global pandemic, sources of stress have multiplied, and are unlikely to disappear any time soon. This means stress management is essential, and needs to kick in quickly and effectively. The survey looks at the intensity of online work, its efficiency and impact on communication, company epidemic prevention and control policies as well as employee care packages and job satisfaction, finding that these have a big impact on the state of mind among employees. Companies should, as far as possible, balance their job satisfaction and work intensity with their employees’ family needs at this time.
6. Cultivating and maintaining positive social relationships is an important indicator of social resilience. Companies should help employees improve their ability to withstand and recover from stressful
Enjoying what you’re reading?
Article Subscribe (1)
Professor profile

ZHANG Xiaomeng
Associate Professor of Organizational Behavior, Associate Dean for EMBA Program, Associate Dean for Inclusivity, Diversity and Equity, Executive Academic Director for Executive Education and Director of the Research Department on Leadership, Behavioral Science & Inclusivity, Cheung Kong Graduate School of Business (CKGSB)
PhD, the R.H. Smith School of Business at University of Maryland, College Park


Related Articles


Our Programs

Scaling Innovation: AI and Digital Strategies for Business Transformation
Global Unicorn Program Series
In partnership with Columbia Engineering
This program is designed to equip senior executives with the strategic insights and tools necessary to lead in this transformative era.
LocationNew York, USA
Date27 Sep - 02 Oct, 2026
LanguageEnglish

Emerging Tech Management Week: Silicon Valley
Global Unicorn Program Series
In partnership with UC Berkeley College of Engineering
This program equips participants with proven strategies, cutting-edge research, and the best-in-class advice to fuel innovation, seize emerging tech developments, and catalyse transformation within your organization.
LocationUC Berkeley
Date01 - 06 Nov, 2026
LanguageEnglish

Asia Start: AI + Digital China Expedition
Asia Start provides entrepreneurs and executives with unparalleled access to Asia’s dynamic digital economy and its business ecosystems, offering the latest trends and insights, strategies, and connections to overcome challenges and unlock future growth for your business in Asia and beyond.
LocationChina (Beijing, Shanghai, Hangzhou & optional Shenzhen)
DateNovember 2-7, 2026
LanguageEnglish
Stanford & Silicon Valley Immersion Program
Global Unicorn Program Series
In partnership with Stanford Engineering Center for Global & Online Education
This CKGSB program equips entrepreneurs, intrapreneurs and key stakeholders with the tools, insights, and skills necessary to lead a new generation of unicorn companies.
LocationStanford University Campus,
California, United States
Date06 - 11 Dec, 2026
LanguageEnglish with Chinese Translation