This survey was led by Dr. Zhang Xiaomeng, Associate Professor of Organizational Behavior, Associate Dean for Executive Education and Co-Director of the Leadership and Motivation Research Centre at the Cheung Kong Graduate School of Business (CKGSB)
The COVID-19 pandemic has forced us to press pause on the Chinese economy, with companies facing challenges on the issues of production and employment resumption. Now more than ever, it is vital that we work together to recover from losses while remaining vigilant to ongoing risks. Individual psychological resilience has a strong bearing on corporate resilience and the time it takes for the Chinese economy to bounce back.
This is part four of the survey series, examining factors affecting stress and how low loyalty may be alarming.
This survey was filled out anonymously by CKGSB students, alumni as well as employees in alumni-led companies. A total of 5,835 valid questionnaires were collected in three days, providing 507,732 data points.
Overall conclusions
The respondents’ overall levels of stress is moderate and levels of loyalty is high. Factors that affect stress and loyalty include: gender, age, location, seniority, years in the company, company size, industry, work resumption status, time management and job satisfaction. Stress has been found to be negatively correlated with loyalty and psychological resilience, which means that stress reduction measures can improve loyalty and resilience at the same time. Thus, companies should employ stress management and psychological counseling for greater organizational effectiveness.
1. Before and after resuming work, the sample of 5,835 entrepreneurs and employees reported moderate levels of stress with an average of 2.96 in the range of 1-5 (the higher the score, the greater the stress).
2. From a gender perspective, female leaders reported significantly higher stress levels (3.13) than male leaders (2.93). Among male respondents, middle managers reported the highest levels of stress (3.19). Except for leaders, female respondents reported less stress than men at all seniority levels.
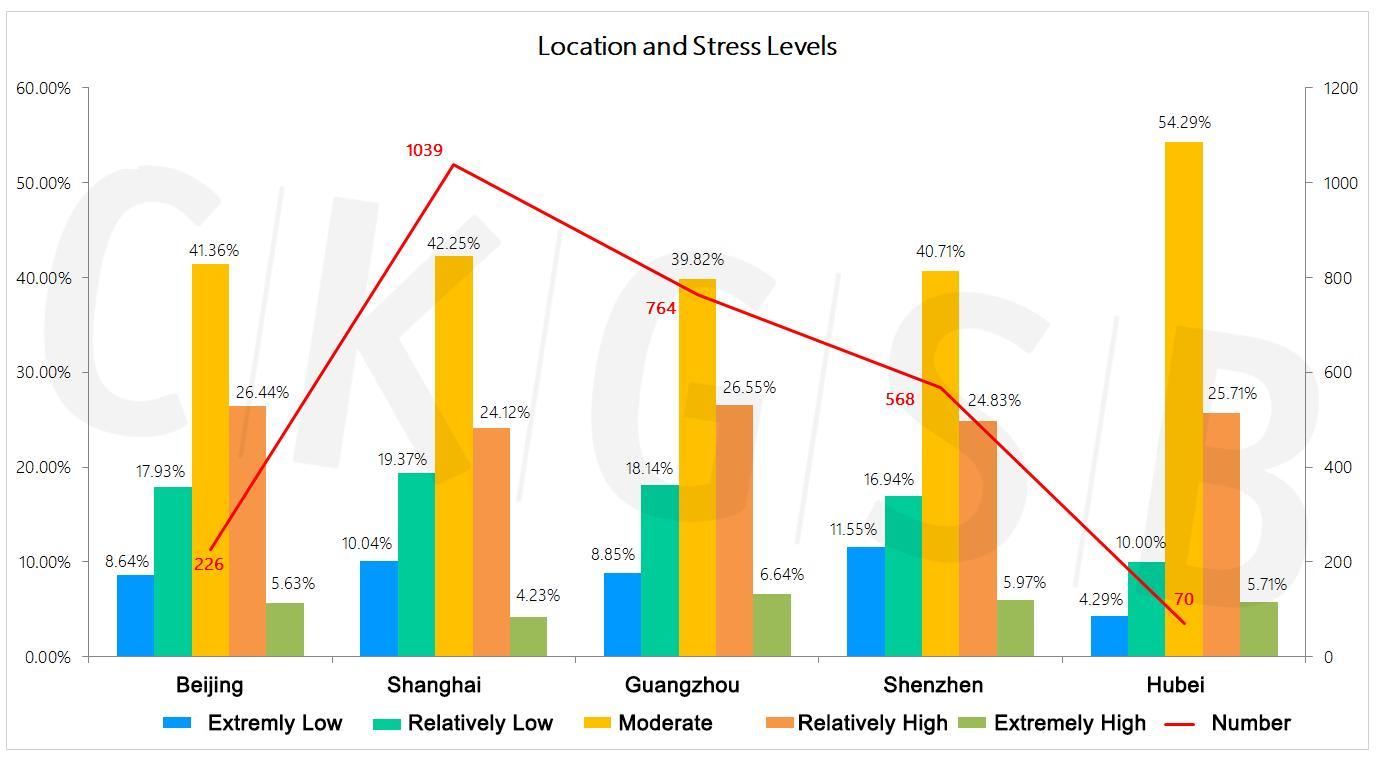
3. In terms of location, respondents working in western China reported the highest levels of stress (3.02), while those working in Hong Kong, Macau, Taiwan and overseas reported the lowest levels of stress (2.84). Among respondents in big cities, those working in Guangzhou had the highest stress levels (3.04) and those in Shanghai the lowest (2.93). Hubei respondents’ average stress level was 3.19, higher than that of Beijing, Guangzhou and Shenzhen.
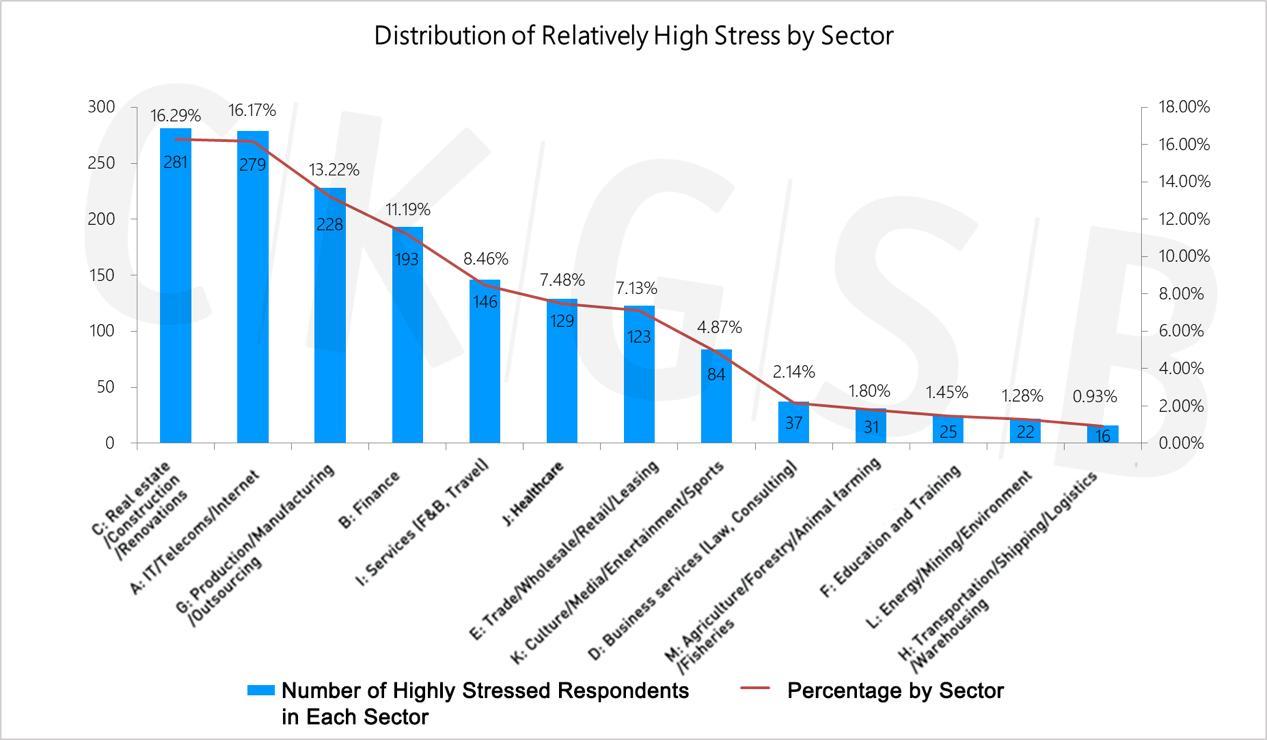
4. From an industry perspective, stress averages across industries did not vary by much. The three industries with the highest percentage of respondents reporting “extremely high stress” and “relatively high stress” are: 16.29% in real estate, 16.17% in the internet sector and 13.22% in manufacturing.
5. The main sources of stress are the epidemic (58.66%), finance (40.19%) and work intensity (26.74%).
6. From a time management perspective, the average length of time respondents spent on sports, communicating with family and friends, hobbies, and social media were all negatively correlated with stress. The data shows that respondents who did not communicate with family and friends reported the highest stress values.
7. Respondents believed the best ways to de-stress were: exercise (67.30%), work (52.36%), and communication with family and friends (50.68%). Those who selected “welfare activities” showed lowest levels of stress. The most effective ways for companies to help employees relieve stress were: improving epidemic prevention measures (72.58%), clarifying strategic goals (50.64%), and for top leaders and executives to engage in morale-boosting (44.92%).
8. The loyalty level of the sample as a whole is relatively high, with an average score of 25.24 out of a maximum of 30. The three sectors with the highest loyalty scores were: agriculture/forestry/farming/fishing (26.74), medical treatment/healthcare (26.28), and real estate (25.55). Loyalty levels among respondents from Hubei (26.13) were higher than average, and higher than for China’s four 1st tier cities (Beijing, Shanghai, Guangzhou and Shenzhen). Loyalty is positively correlated with respondents’ age, rank, years of work, and size of company. SMEs face the highest risk of low-level loyalty.
9. Stress and loyalty are negatively correlated, and loyalty and psychological resilience are positively correlated; Respondents that are more satisfied with their company’s epidemic prevention measures, employee care, colleagues’ communications, and their satisfaction with their work status, tend to be less stressed and more loyal.
Stress level
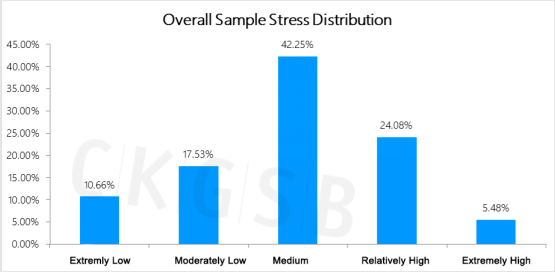
The survey data shows that the average stress level of the 5,835 surveyed entrepreneurs and employees is moderate at 2.96.
*Note: We indexed each respondent’s stress level, assigning a value of 1-5. The higher the stress score, the greater the stress level of the respondent.
As can be seen from the distribution, 42.25% of respondents (2,465 people) reported moderate stress; 24.08% of respondents (1,405 people) reported relatively high stress; 17.53% of respondents (1,023 people) reported a low stress level; 10.66% of respondents (6,22 people) reported very low stress; 5.48% of respondents (320 people) reported very high stress.
Sample overview
1. By gender:
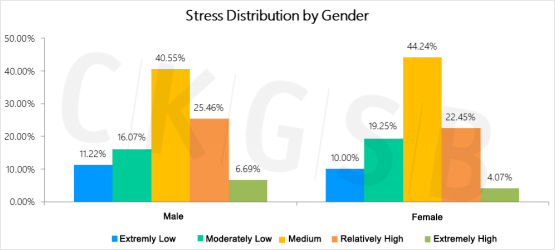
Overall, the stress level of women in the sample (2.91) is slightly lower than that of men (3.0). More men selected “very low stress”, “high stress”, and “very high stress” than women, while more women selected “low stress” and “moderate stress” than men.
For a detailed analysis of the gender dimension, see Episode 2: Gender Differences.
2. By seniority
From the perspective of seniority, middle managers have the highest level of stress (3.08) and employees have the lowest level of stress (2.87).
![]()
From the perspective of gender x seniority, female leaders and male middle managers reported the highest levels of stress. As shown in the graph below, female leaders have significantly higher levels of stress (3.13) than male leaders (2.93); the whole sample’s average stress value is 2.96. The male sample’s stress level is clearly inverted u-shaped; at its highest are middle managers (3.19). Except for at leadership level, female respondents of all seniority levels were less stressed than men.
![]()
3. By location:
Judging from the place of work of survey respondents, those working in the west of China reported highest levels of stress (3.02), and those in Hong Kong, Macao, Taiwan and overseas reported the lowest levels of stress (2.84).

Among the four first-tier cities of Beijing, Shanghai, Guangzhou and Shenzhen, respondents with the highest levels of stress are in Guangzhou (3.04) and Shanghai (2.93). We paid particular attention to the Hubei region, in which stress is reported to be 3.19, higher than the four first-tier cities.
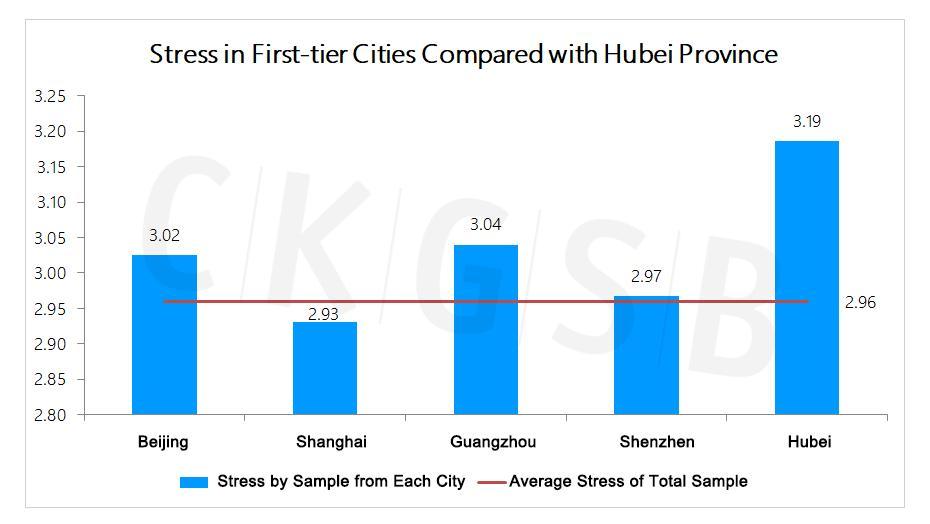
It is worth noting that although the overall stress value of the respondents from Hubei is relatively high, in the self-assessment, 54.29% of the respondents in Hubei believed that their current stress level was moderate, which is higher than that of respondents in Beijing, Shanghai, Guangzhou, and Shenzhen; the proportion of respondents with very small stress (4.29%) and with relatively small stress (10%) are relatively lower than those of the above four major cities.
* Note: The maximum sample size in Shanghai is 1,039, and the sample size in Hubei is relatively small, 70.
4. By industry:
According to the stress analysis of the entire sample, various calculations show that the difference of average pressure between industries is small, but industries with the most respondents reporting “extremely high pressure” and “relatively high pressure” are housing (16.29%), the internet (16.17%) and manufacturing (13.22%). The distribution in various industries is shown in the figure below.
Sources and management of stress
1. Sources of stress:
The three main sources of stress were the epidemic (58.66%), finance (40.19%) and work intensity (26.74%).
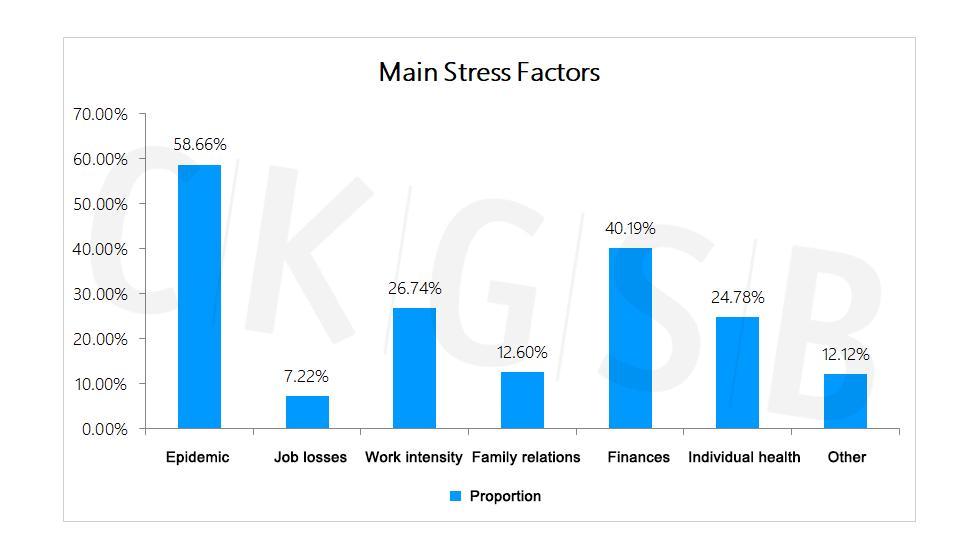
* Note: This was a multiple-choice question, so percentages add up to more than 100%.
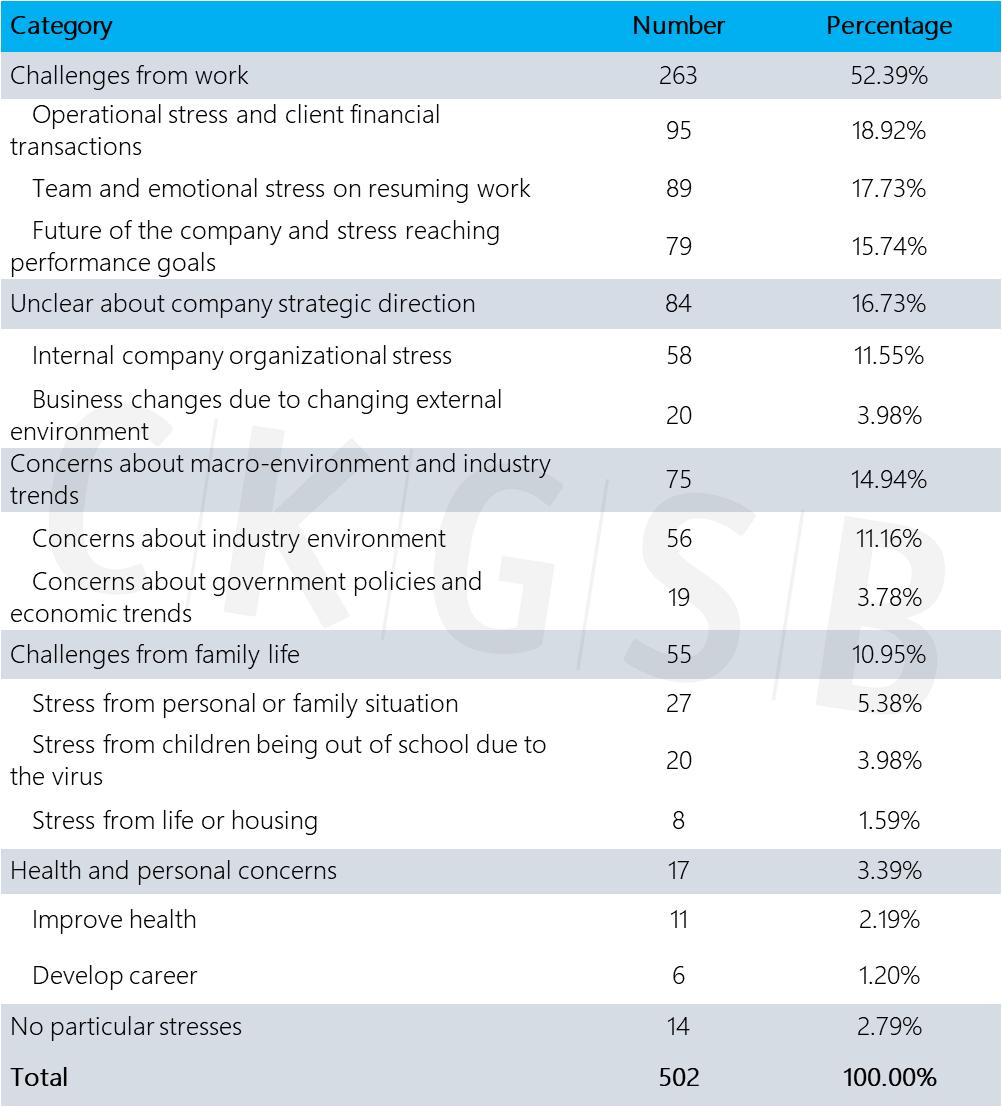
Among the total of 502 valid “other” responses received, the top three stressors were challenges at work (52.39%), unclear corporate strategic direction (16.73%), and concerns about overall business and industry conditions (14.94%).
2. Personal time management:
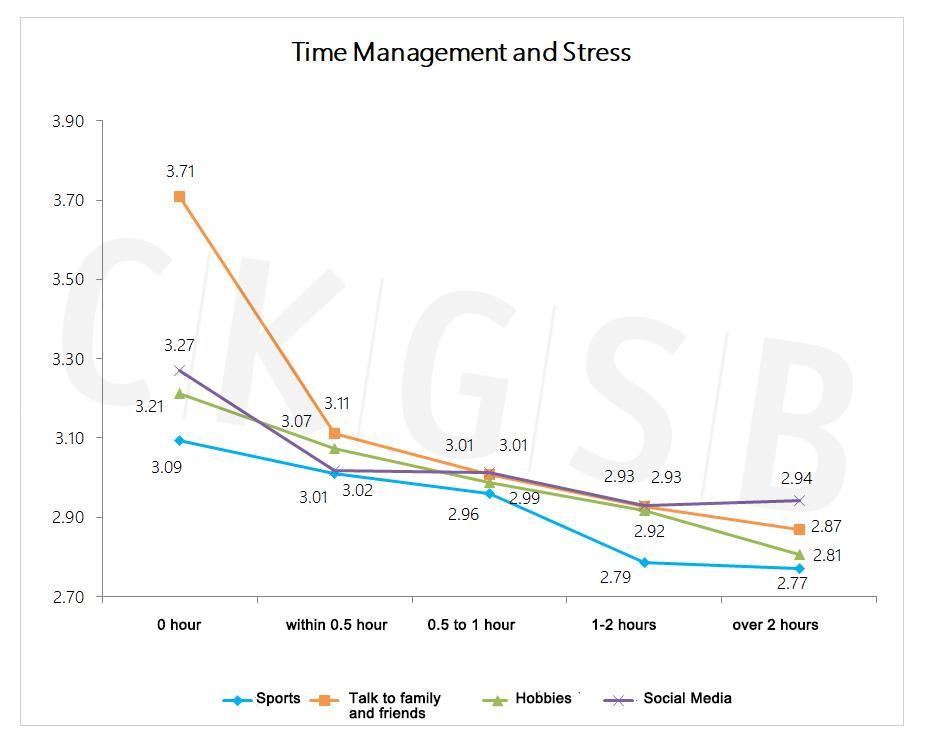
We asked respondents about the amount of time people practiced sports, talked to family and friends, engaged in personal hobbies, and checked social media. The results showed that the length of time spent on the four activities above was negatively correlated with stress, with Spearman coefficients of -0.08 **, -0.07 **, -0.11 **, and -0.02 **, and p less than 0.01, indicating that with an increase in time spent on these activities, the degree of stress fell to varying degrees. It is worth noting that respondents who were not in contact with family or friends had significantly higher levels of stress than those in communication. Regarding social media, for those spending more than two hours online, stress increased from 2.93 to 2.94. There is a certain difference in the negative correlation between the use of social media and sports, personal hobbies, communication with family / friends and stress values. Previous studies have shown that over-reliance on electronic devices is an important indicator of increased stress.
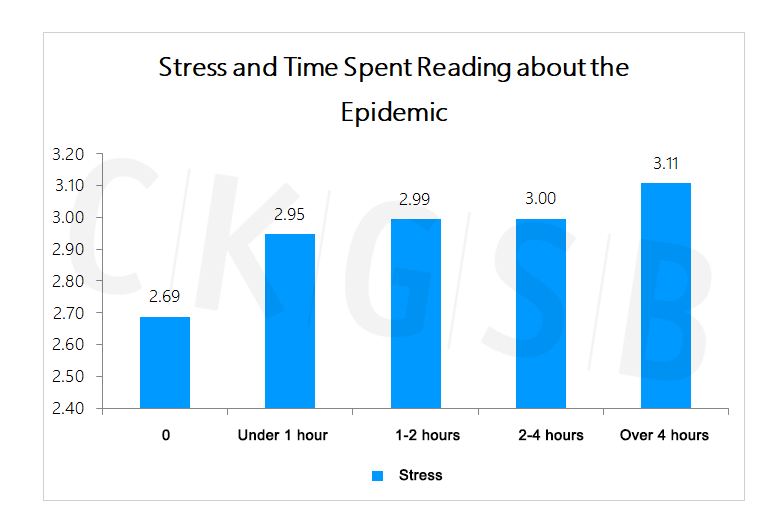
Stress also has a positive correlation with time spent gaining information on the epidemic with a Spearman coefficient of 0.34 **, and p less than 0.01. This suggests that stress rises as people spend more time seeking for information on the epidemic.
3. Personal stress relieving methods:
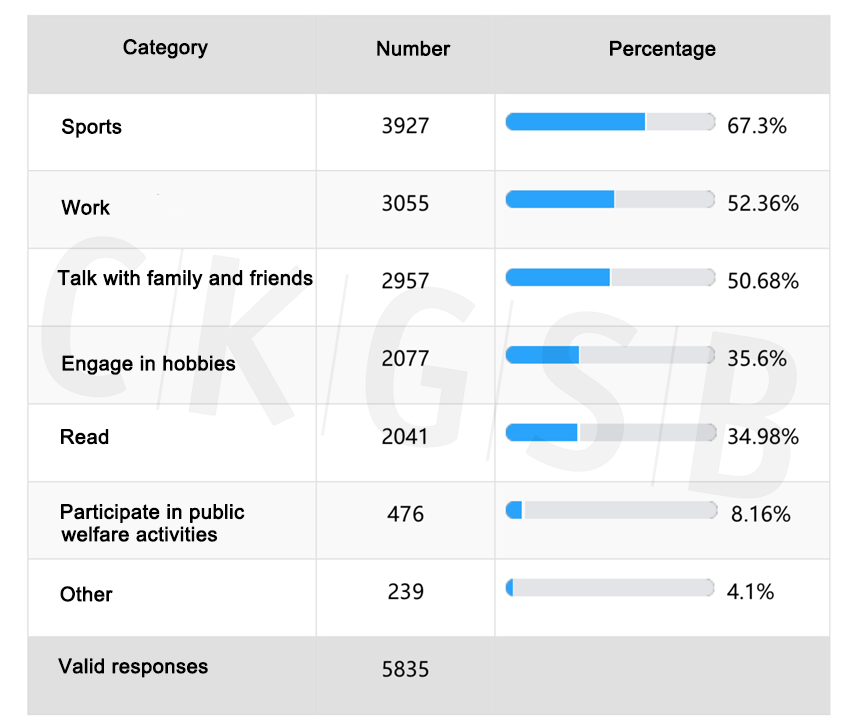
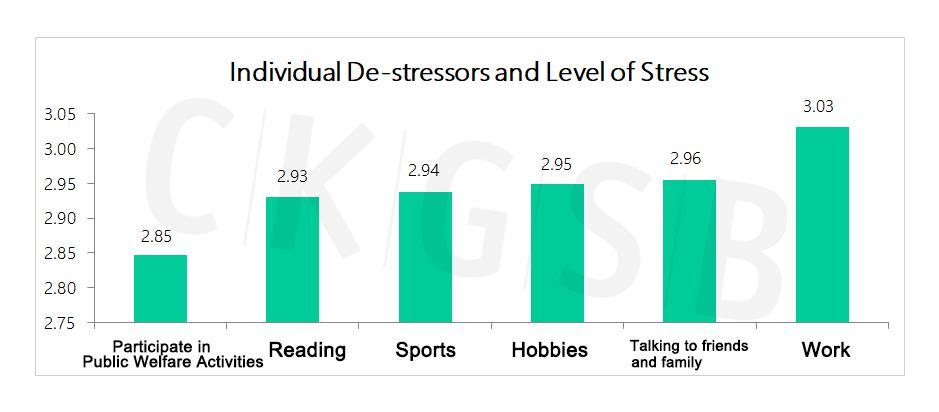
Our survey also looked at how people relieved stress. The distribution of methods is presented in the figure below. Those scoring highest were exercise (67.30%), work (52.36%) and talking to family and friends (50.68%).
* Note: This is a multiple-choice question which means that percentages add up to more than 100%.
It is interesting to note that while the proportion of respondents “participating in public welfare activities” was the lowest at 8.16%, these respondents had the lowest levels of stress (2.85), while respondents who chose to work to relieve stress had the highest levels of stress (3.03).
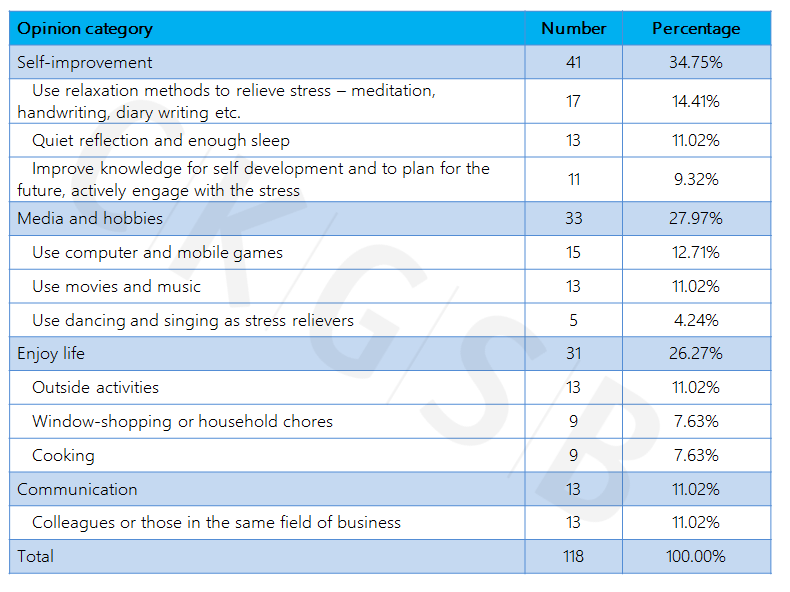
We also asked survey respondents about other stress relievers they turned to. A total of 239 valid responses were received, and 118 activities were summarized. Among them, 41 or 34.75% involved self-cultivation, 33 or 27.97% involved entertainment or hobbies, 31 or 26.27% involved enjoying life, and 13 or 11.02% involved interpersonal communication.
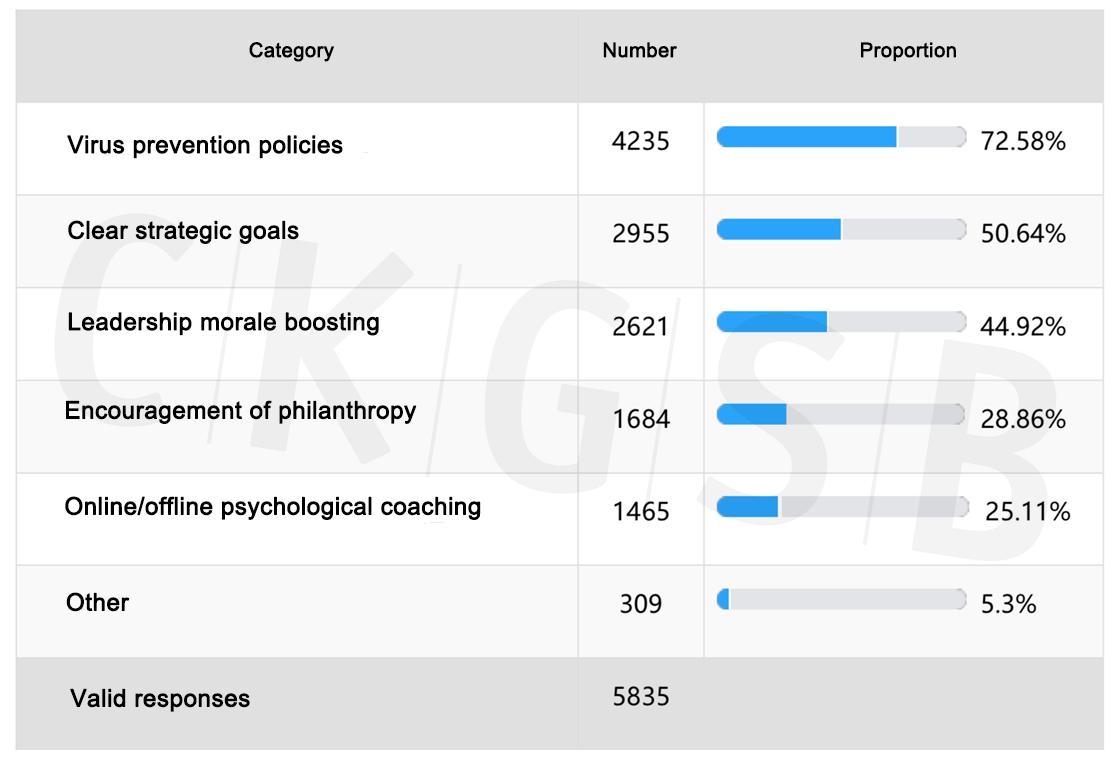
Respondents believe that the three most effective ways for companies to help employees relieve stress were: improving epidemic prevention measures (72.58%), defining strategic goals (50.64%), and personal morale boosting by leaders and executives (44.92%).
When analyzing stress levels and ways for companies to help employees alleviate stress, those who selected “excellent epidemic prevention measures” had significantly lower stress levels than those selecting other options.
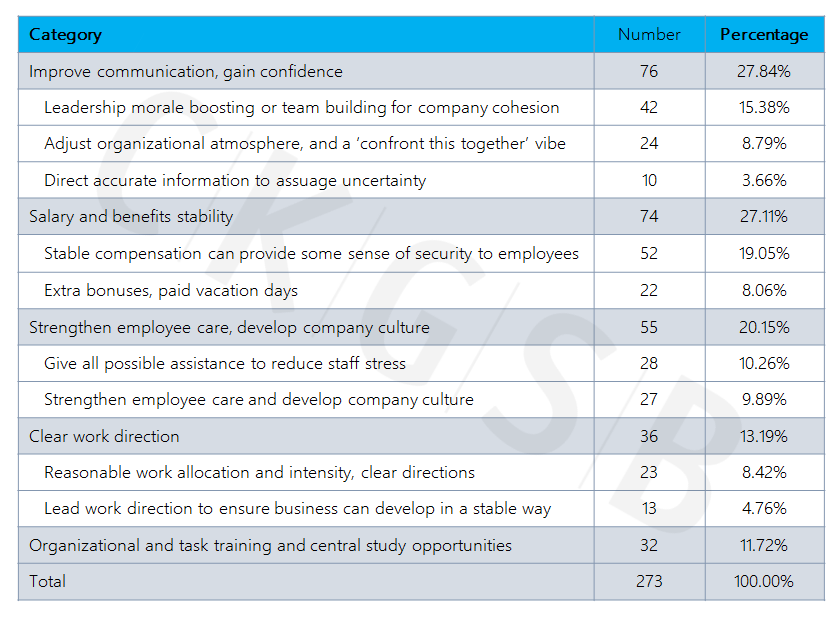
We also asked respondents about other effective methods to help employees de-stress. A total of 309 valid responses were obtained, among which 273 methods were compiled. The most effective methods included: better communication, improved confidence (76, accounting for 27.84%), stable salary and welfare (74, accounting for 27.11%), strengthened employee care and corporate culture (55, accounting for 20.15%), clear work implementation (36, accounting for 13.19%) and organizing business trainings (32, accounting for 11.72%).
Correlation between resuming work and stress
1. Enterprise operations and performance expectations:
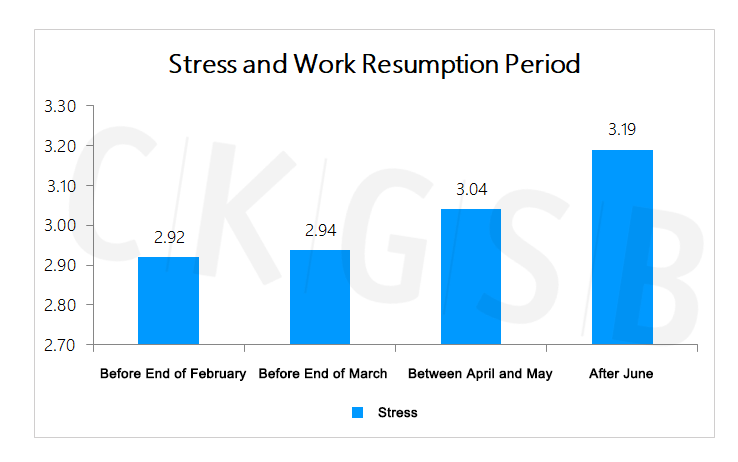
Respondents’ judgment on the recovery of their company’s business was positively correlated with stress, with a Spearman coefficient of 0.05 **, and p of less than 0.01. The later respondents thought their company would have completely recovered, the higher the stress level. Respondents who judged their company would have fully recovered in June and later recorded the highest levels of stress (3.19), and those who judged that their company would recover before the end of February recorded the lowest level of stress (2.92).
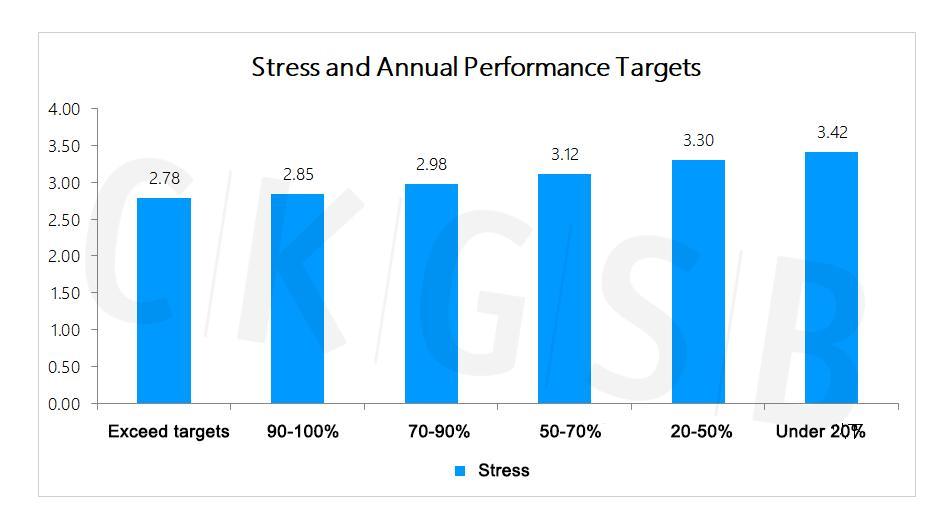
Our sample’s expectations on company annual performance is negatively correlated with the stress, with a Spearman correlation coefficient of -0.13 **, and p of less than 0.01. This means that as optimism regarding their company’s completion of their performance goals decreased, respondents’ stress levels rose.
2. Working hours and efficiency
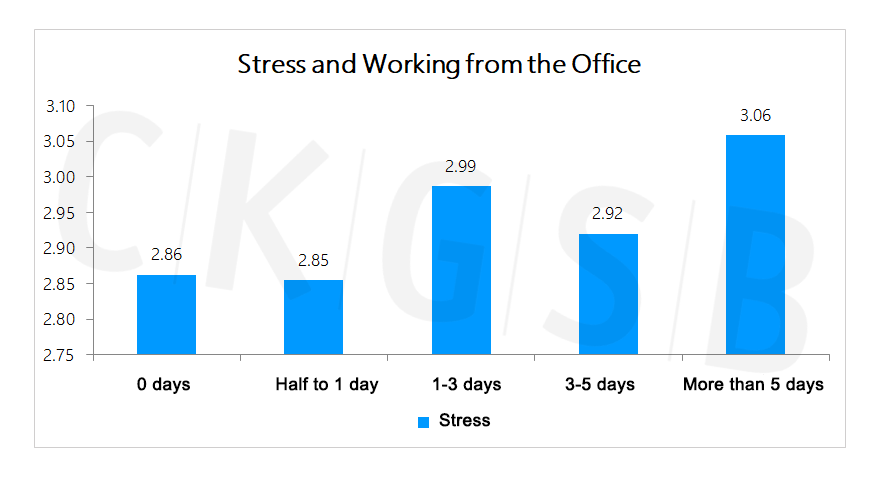
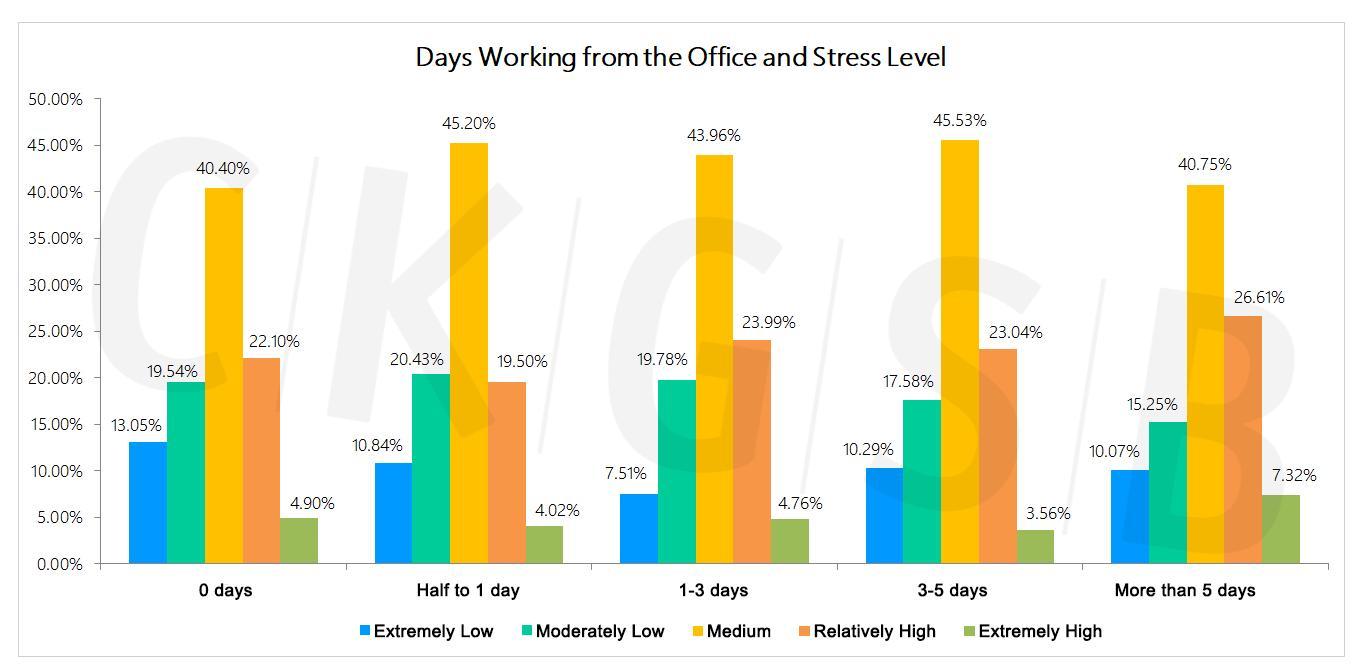
From the perspective of hours working in the office, the most stressed were respondents who went to the office five days a week (3.06). 26.61% of these respondents reported high levels of stress and 7.32% reported extremely high levels of stress. Recalling our analysis of resilience: as office hours increased, resilience grew and depression and anxiety declined. Yet from the perspective of stressors, respondents going to the office for five or more days a week may develop a higher level of concern about the virus situation and experience greater work intensity. They may not be able to take care of their family and this may be an important contributor to stress.
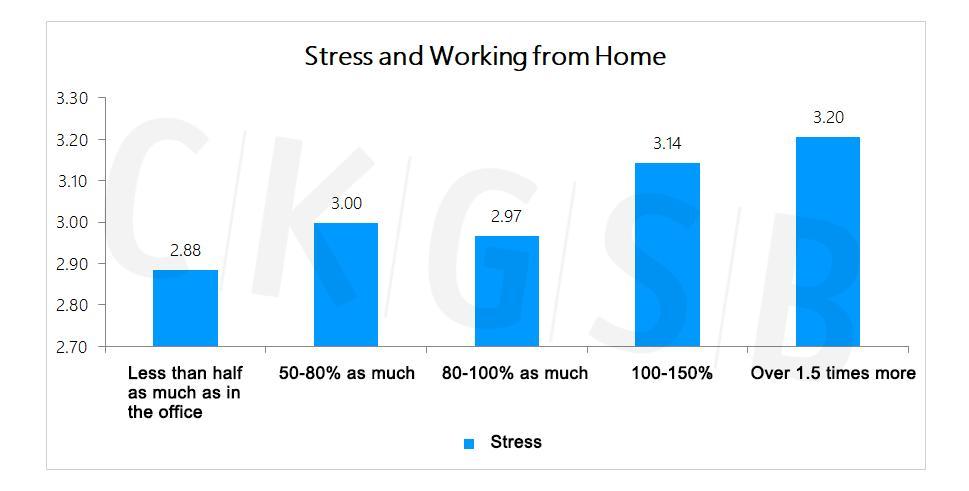
Working at home has become the new normal in the coronavirus era. We decided to compare “working hours at home” with “working hours at the office.” The data shows that, overall, those under the greatest stress “work from home more than 1.5 times longer than at the office.” However, 12.15% of respondents who “work from home more than 1.5 times longer than at the office” reported very low levels of stress, indicating that these home workers have great resilience to stress. These results are consistent with our conclusions regarding resilience. The data shows that those with the highest psychological resilience scores are those who “work from home more than 1.5 times longer than in the office”, but they also have high levels of anxiety and depression.
For detailed analysis of building resilience, see Episode 3: Building Organizational Resilience.

As for working efficiency at home, respondents who see no difference from working in the office are least stressed (2.85) whereas those who feel a significant drop in efficiency report feeling most stressed (3.13). Even among survey respondents experiencing a clear increase in efficiency, the proportion of these who report feeling highly stressed is significant (14.71%), reflecting perhaps the psychological pressure of adapting to a new way of working from home. A substantial increase in efficiency may be accompanied by increased workload and intensity.
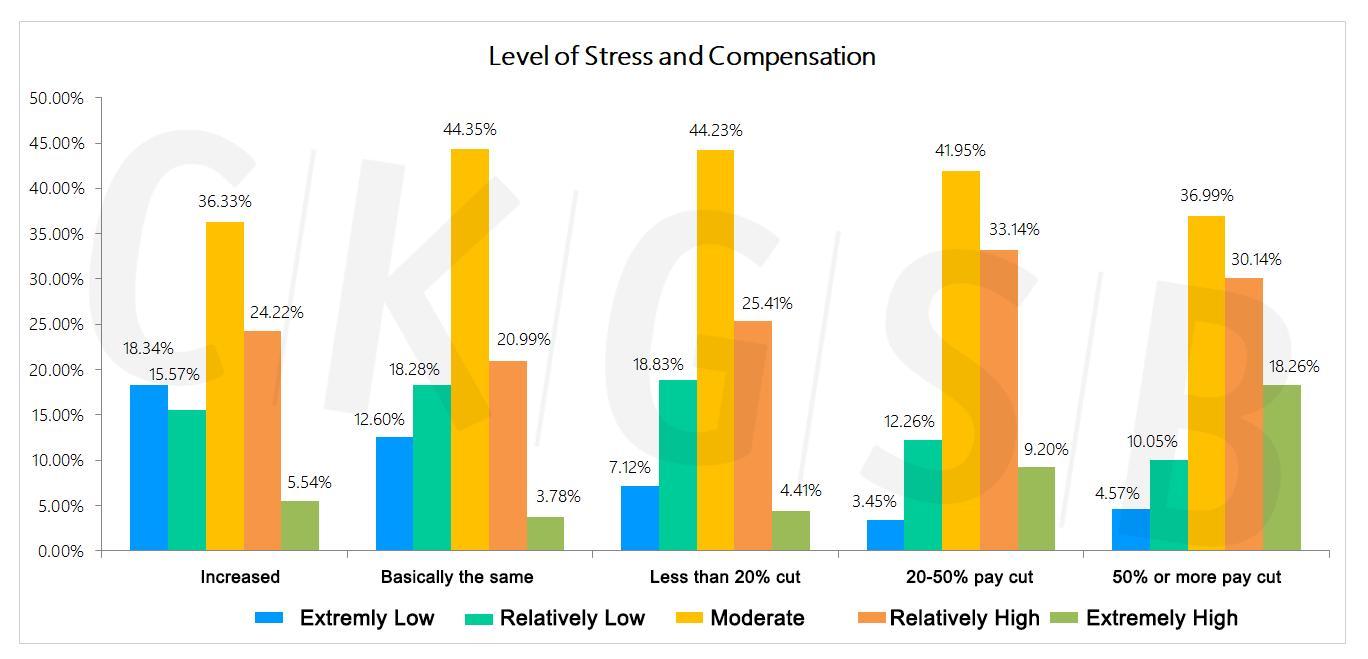
3. Pay cuts, layoffs and income expectations:
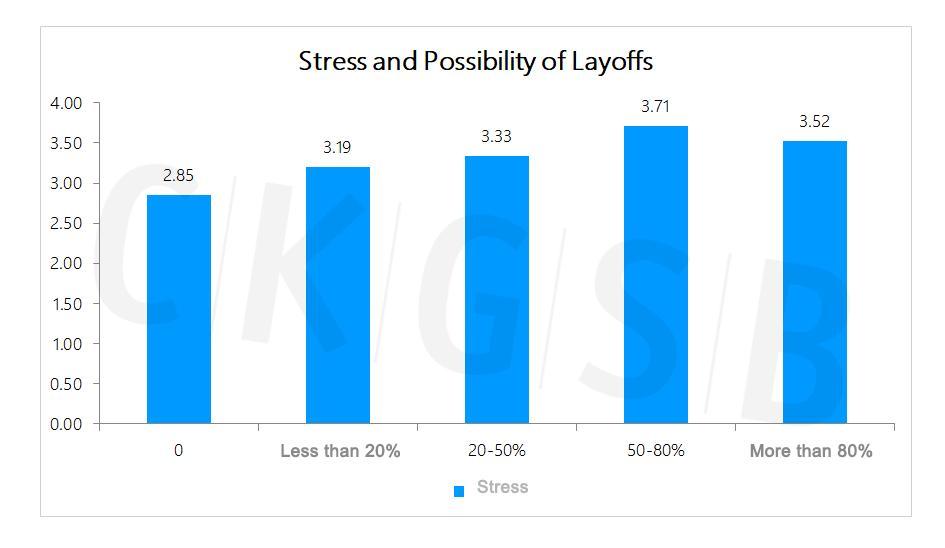
Pay cuts and layoffs are positively correlated with stress. The Spearman correlation coefficients are 0.10 ** and 0.12 ** respectively, and p is less than 0.01, indicating that the more a company cuts pay and lays off staff, the higher its employees’ stress factor.
Those who expect to be laid off or to take a pay cut are more likely to feel stressed. The Spearman coefficients are 0.12 ** and 0.10 ** respectively, and p is less than 0.01, indicating that as the chance of being laid off increases or one’s company becomes less likely to offer a pay rise, stress rises.
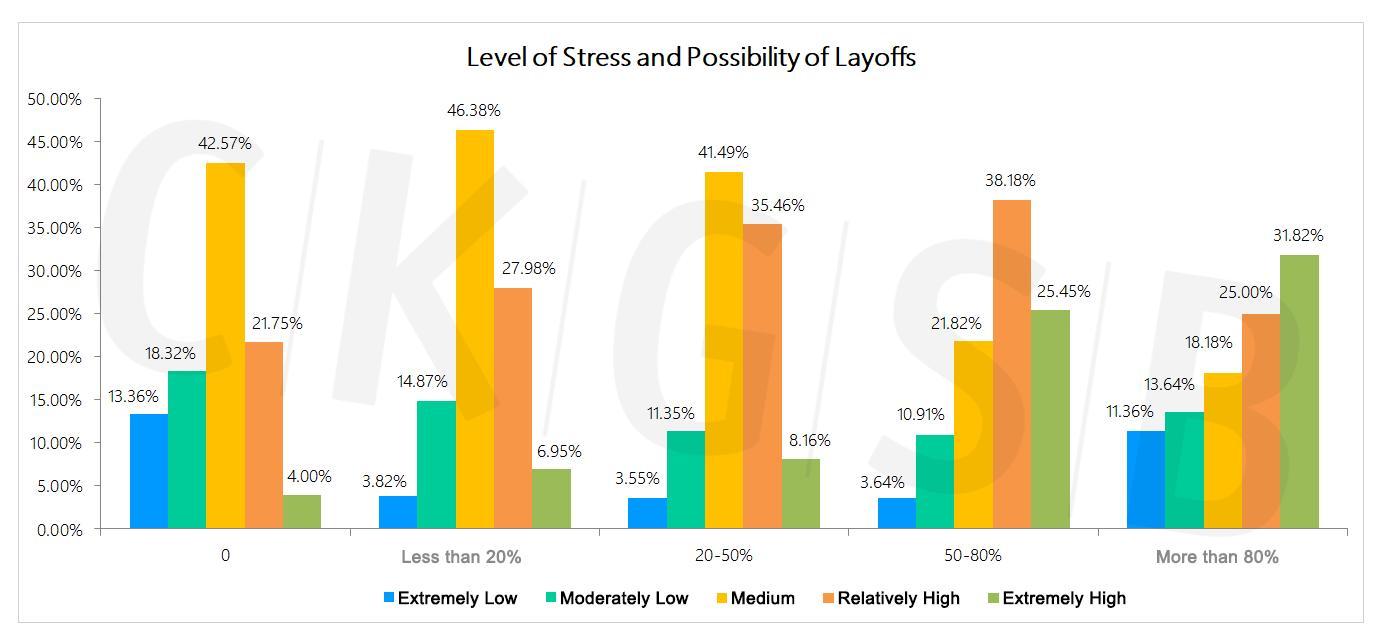
It is worth noting that respondents who think they are 80% likely to be laid off have lower stress levels than those who think the chance is “50-80%.” At the same time, among respondents who think they are 80% likely to be laid off, there is a high proportion of low stress (11.36%), as well as the highest proportion of high stress (31.82%), indicating that some interviewees who were more certain about expected layoffs, showed polarized psychological stress.
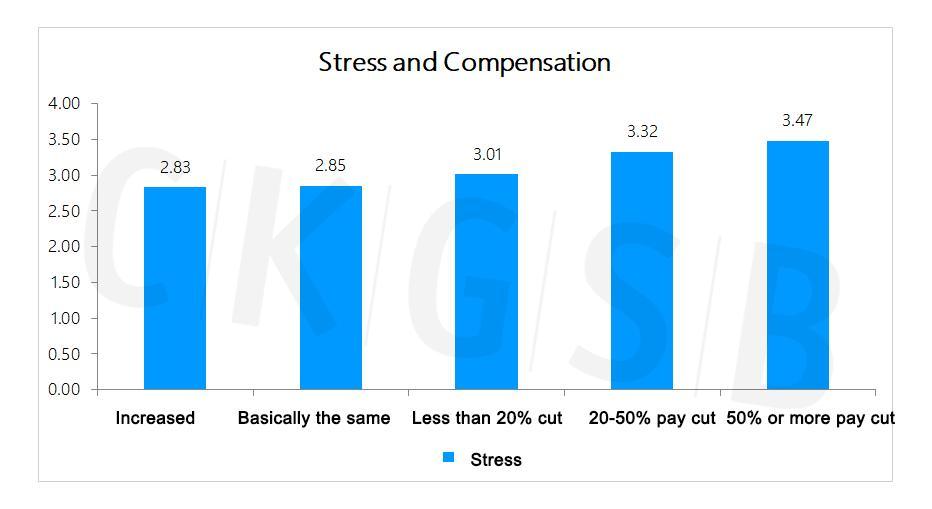
As for predicting income changes, the most stressed were respondents who “expected their annual salary and bonuses to fall by more than 50%” (3.47). The least stressed were those who expected their annual salary and bonuses to increase (2.83), but among them, 5.54% were “very stressed” presumably related to the epidemic and the intensity of work.
Loyalty
The loyalty of the sample as a whole was found to be relatively high, with an average score of 25.24 out of 30.
1. By gender and seniority
The gender difference in loyalty scores was not found to be significant, with male loyalty (25.51) slightly higher than female loyalty (24.97).
There was a positive correlation between loyalty and seniority with a Spearman correlation coefficient of 0.26 ** and p less than 0.01, indicating that as seniority in the company increased, loyalty grew.
Looking at the correlation between gender and seniority, male loyalty scores at all seniority levels were found to be slightly higher than female loyalty scores. The highest average loyalty score was found among male senior managers (26.80), and the lowest among female junior managers (24.48).
![]()
2. By age:
Age was positively correlated with loyalty. The Spearman coefficient was 0.06 **, with p less than 0.01, indicating that as age increased, loyalty did too. The lowest loyalty level was seen among respondents aged 19-29 (24.13), and the highest among respondents aged 60-69 (27.24).

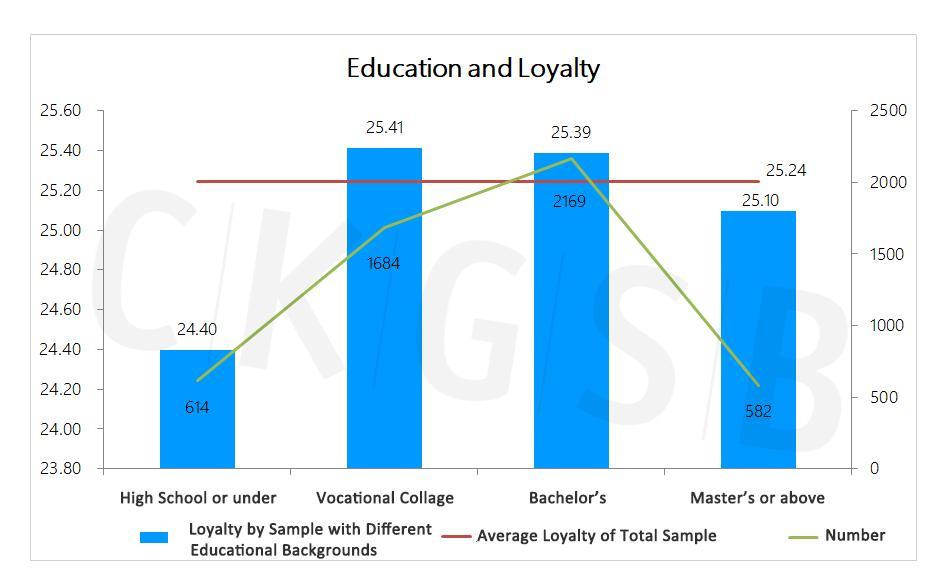
3. By educational background:
Analyzing the correlation between educational background and loyalty, we found the highest loyalty levels among those with secondary to tertiary education (25.41), and the lowest among those with high school diplomas or below (24.40).
4. By geographical location
Respondents working in the central region of China were found to have the highest loyalty scores (26.03), whereas those in Hong Kong, Macao, Taiwan and overseas had the lowest loyalty scores (23.67; due to the small number of respondents from Hong Kong, Macao, Taiwan and overseas, there is the possibility of a data deviation).
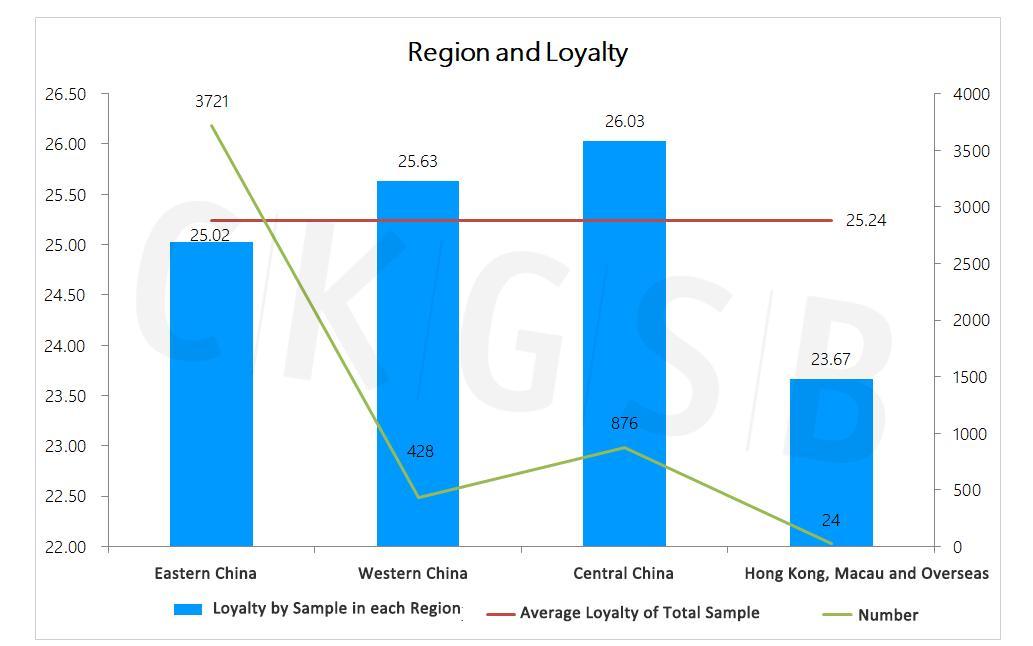
The loyalty scores for respondents from the four first-tier cities (Beijing, Shanghai, Guangzhou and Shenzhen) were in overall terms lower than average (25.24). Taking just those from Shanghai however, their loyalty levels were the highest (25.00). Those working in Hubei had much higher loyalty levels than those in the first-tier cities as well as higher than the overall average (26.13).

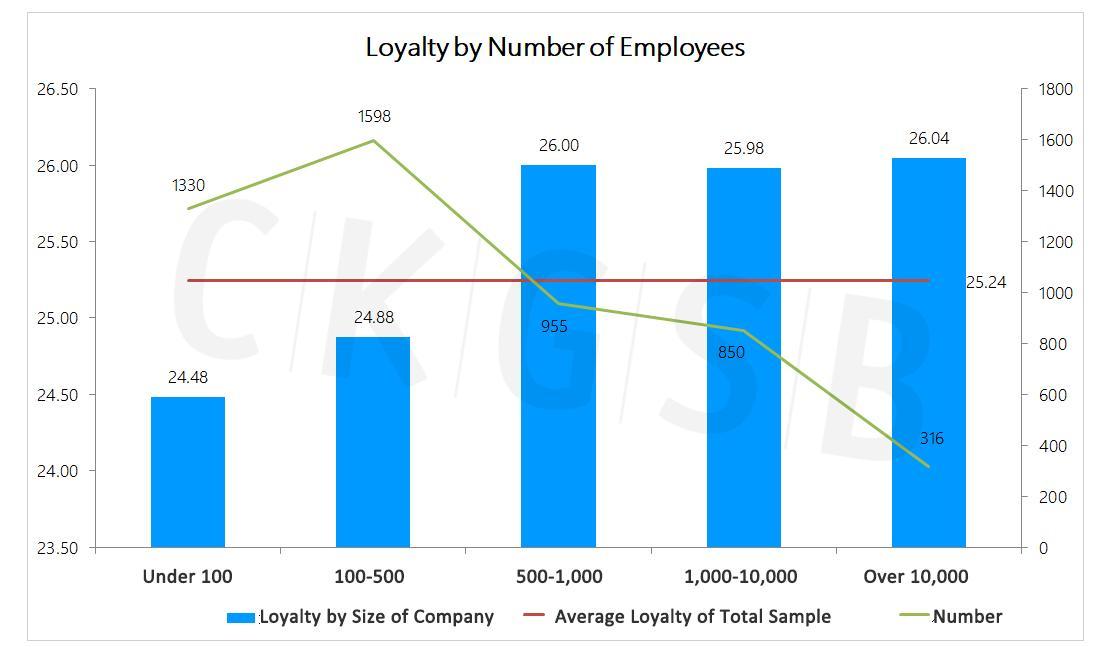
5. By company size:
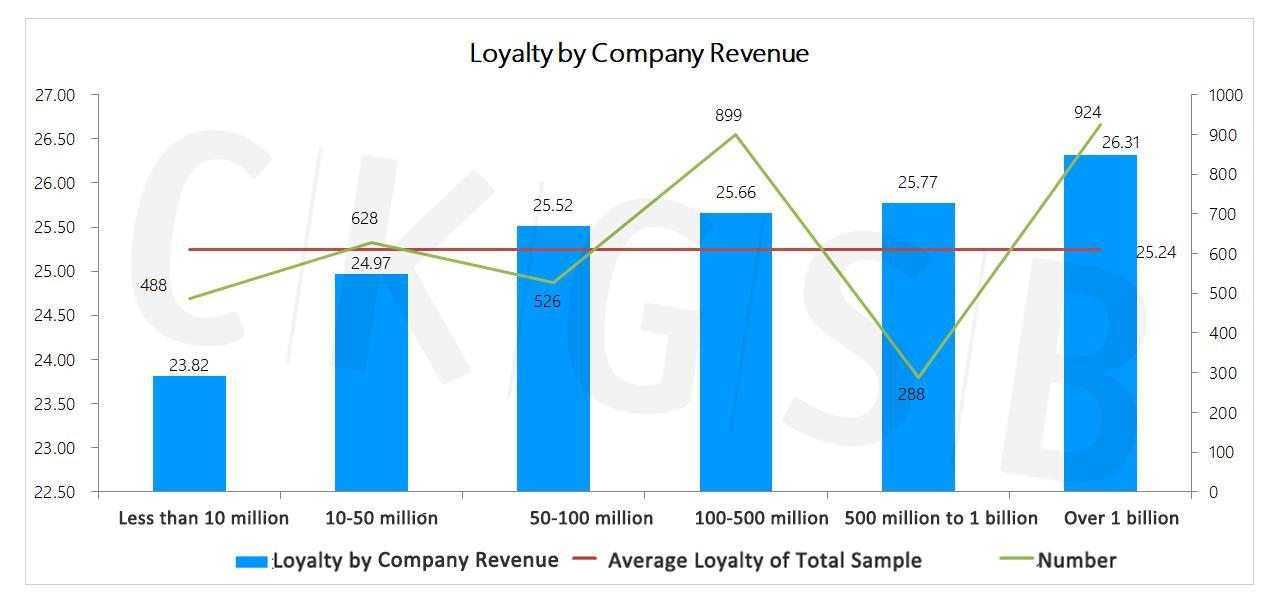
The number of employees in a respondent’s company and the company’s revenue scale was positively correlated with loyalty. The Spearman correlation coefficients were 0.19 ** and 0.11 ** respectively, and p was less than 0.01, indicating that as the size of a company increased and revenue increased, loyalty was higher. Respondents from companies with fewer than 100 employees and those with annual revenues of less than 10 million had the lowest levels of loyalty (24.48 and 23.82 respectively).
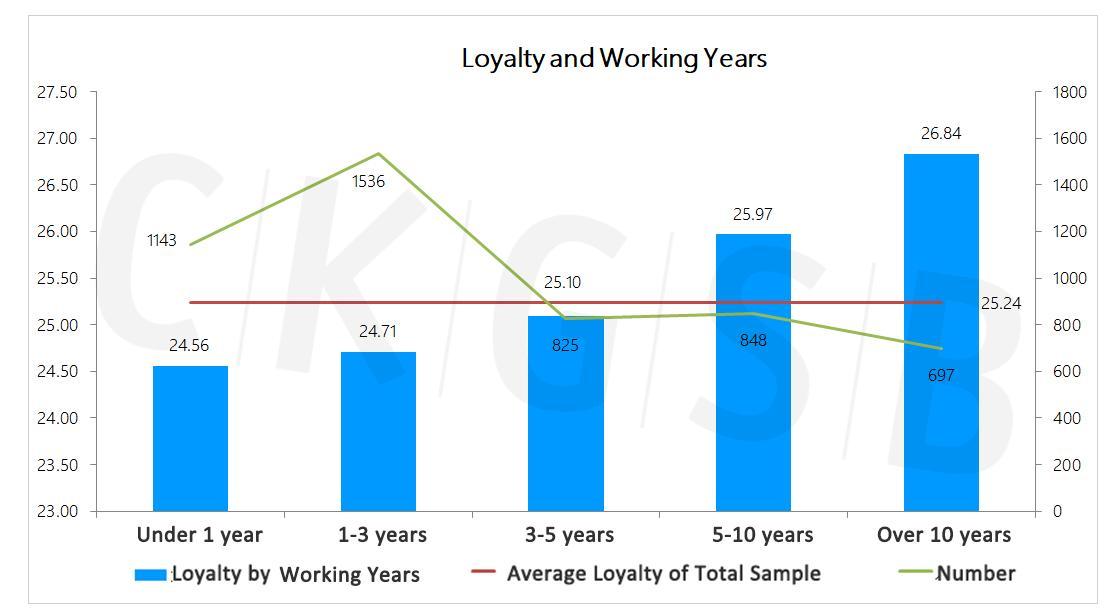
6. Working years:
Respondents’ loyalty scores were positively correlated with number of working years. The Spearman coefficient was 0.08 **, and p less than 0.01, indicating that with an increase in years at work, loyalty showed an upward trend.
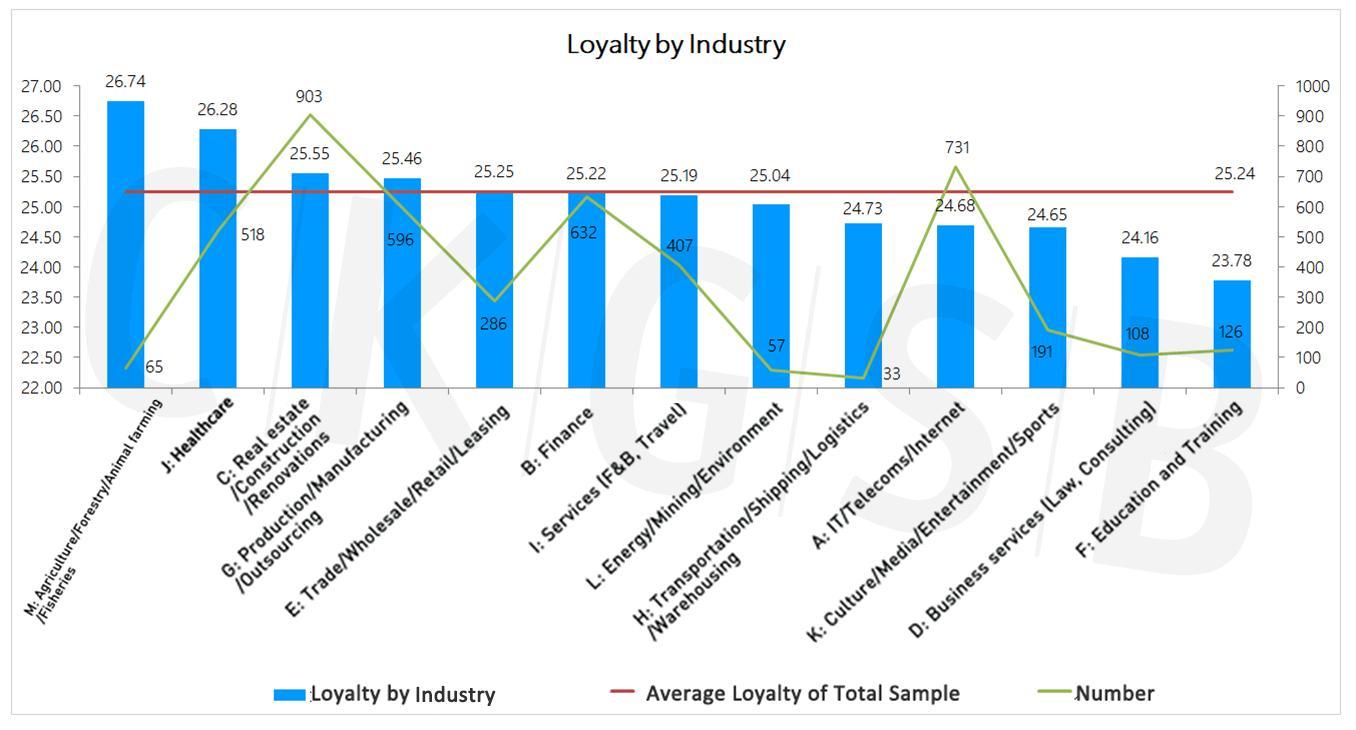
7. By industry
The three industries with the highest loyalty scores were: agriculture/forestry/farming/fishing sectors (26.74), medical treatment/healthcare (26.28), and real estate (25.55). The three industries with the lowest loyalty scores were culture/media/entertainment/sports (24.65), business services (24.16) and education/training (23.78), these were also the three industries most heavily affected by the epidemic.
Other factors affecting loyalty and stress
1. Relationship between loyalty and stress:
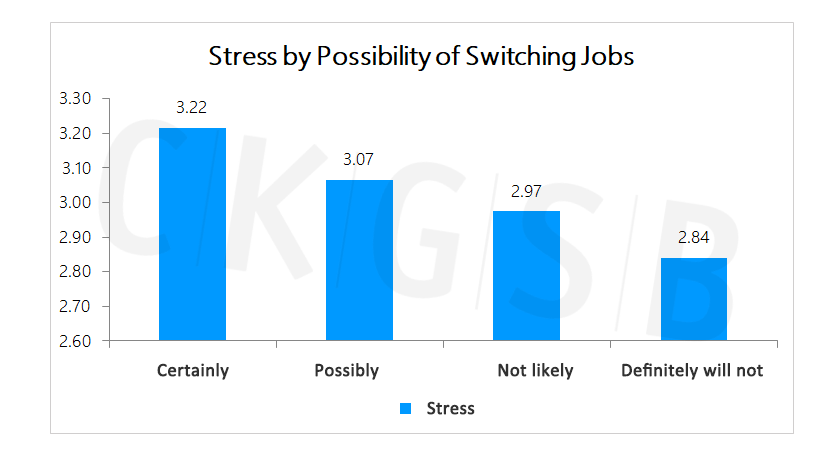
The possibility of switching jobs was positively correlated with the degree of stress. The Spearman correlation coefficient was 0.07 **, and p was less than 0.01, indicating that as the respondent’s expectations regarding job-hopping decreased, stress level fell.
In addition, stress and loyalty have a negative correlation. The Spearman correlation coefficient was -0.06 **, and p was less than 0.01, indicating that with an increase in loyalty, stress fell.
2. Correlation between work resumption status and loyalty
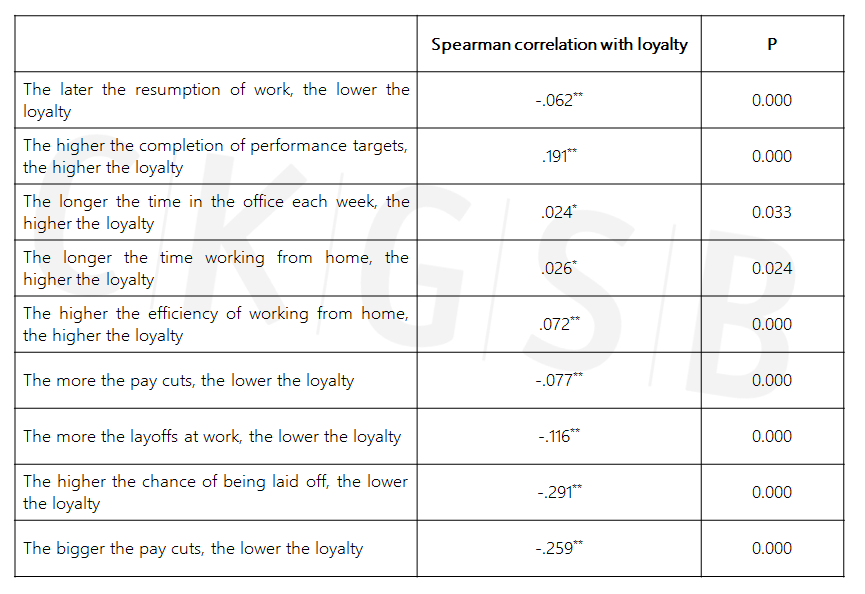
Loyalty and stress were negatively correlated, meaning factors that affected stress were negatively correlated with loyalty. The main variables are shown in the following table:
3. Time management:
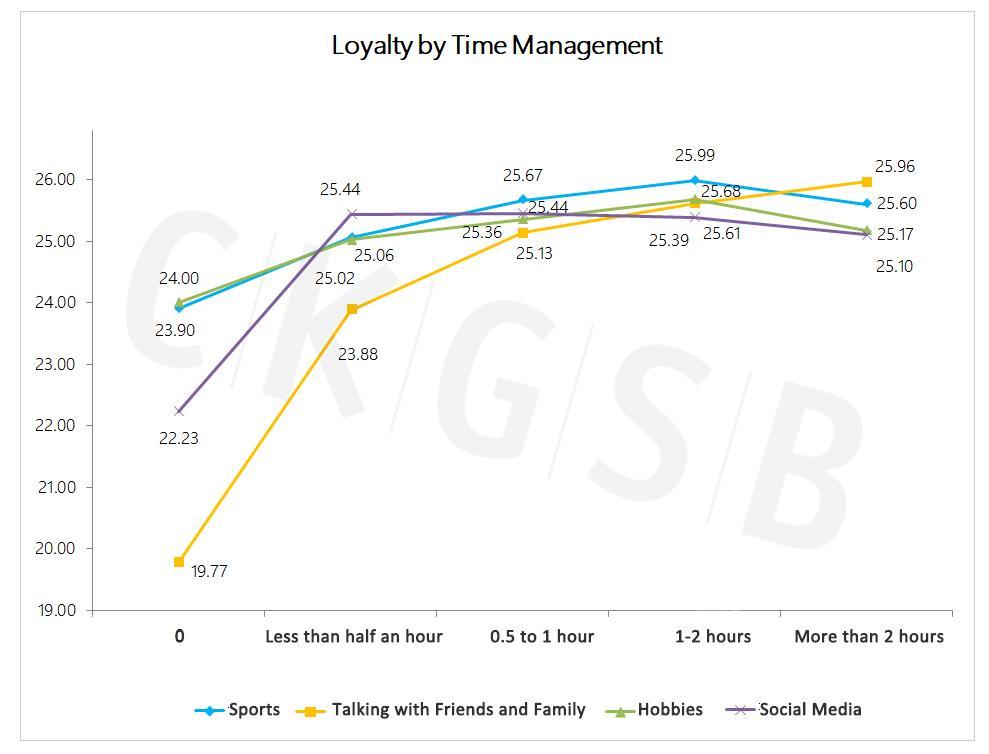
The length of time respondents spent on sports (blue curve) and talking to family / friends (orange curve) was positively correlated with loyalty. The Spearman coefficients were 0.05 ** and 0.09 ** respectively, and p was less than 0.01, indicating that with an increase in the length of time spent on these two activities, loyalty increased. However, time spent on social media (purple curve) was found to be negatively correlated with loyalty with a Spearman correlation coefficient of -0.03 **, and p of less than 0.01, indicating that with an increase in respondents’ time spent on social media, loyalty went down. There is no correlation between the length of time used for personal hobbies (green curve) and loyalty. It is worth noting that although the duration of using social media was found to be negatively correlated with loyalty, not using social media at all was also detrimental to loyalty as team members need social media to maintain their non-work communication between each other.
In our analysis of resilience, we found that current stress was negatively correlated with resilience, and strongly correlated with depression and anxiety, which means that as respondents were reducing stress levels, the level of psychological resilience showed an uptick, and depression and anxiety were seen to be falling.
Respondents’ loyalty scores (leaders did not need to answer this question; the highest score was 30), showed a positive correlation with resilience and a negative correlation with depression and anxiety. The Spearman coefficient was -0.23 ** and p was less than 0.01, meaning that with an increase in loyalty, psychological resilience increased, and depression and anxiety levels fell.
* Note: For detailed charts and analysis, see Episode 3: Building Organizational Resilience.
As respondents’ satisfaction with their company’s epidemic prevention measures, employee care package, work communication, and job status increased, the degree of stress showed a downward trend and loyalty showed an upward trend.
Conclusions
Before and after resuming work, our sample of highly loyal workers had an overall moderate stress level. The major stressors our respondents experienced during the survey period were the epidemic, finances and work intensity. They found exercise, working and talking to family and friends the best ways to de-stress. The most effective forms of counseling from their companies were improving anti-epidemic measures, clarifying strategic objectives, and for top leaders and executives to be personally involved in boosting morale.
From an objective standpoint, in terms of stress management, companies should focus on male employees, young employees and middle managers who tend to have higher levels of stress than other groups. In terms of loyalty, they should focus on young employees, new employees, female employees and high academic achievers who are less loyal than other groups. Companies should identify those with high stress resilience and high levels of loyalty in all seniority levels, including employees who have been with the company for a long time and core executives, so that they can help stabilize and improve morale.
From the perspective of work resumption, salary cuts, layoffs, and performance target adjustments are closely related to stress and loyalty among staff. The survey shows that respondents who think they are more than 80% likely to be laid off are less stressed than those who are 50-80% likely to be laid off, reflecting the pressure caused by uncertainty. Analysis shows that in addition to the epidemic itself, work and family challenges and unclear corporate strategies led to the high stress levels of many respondents. Companies should consider clarifying future performance goals and strategic adjustments to employees, and share this information throughout the company, as giving employees clear expectations helps them regain a sense of control.
As for working style, remote working may increase working hours, reduce efficiency and lead to poorer communication, which may thus increase stress. The survey shows that as remote working efficiency and communication improved, stress was reduced and loyalty improved. Most respondents believe that working is one way to de-stress, so companies should arrange workloads in a reasonable way, so that remote working gives employees a sense of fulfillment and control, and enables them to balance work with life.
From the perspective of employee care, companies should strongly encourage employees to form an active lifestyle, invest reasonable time in sports and fitness, communicate with family and/or friends, cultivate personal hobbies, and self-cultivation. These factors can not only help employees reduce anxiety and depression, but it also has an important role in promoting employees’ loyalty. The survey found that concerns about personal career development are one of the sources of pressure for respondents. Companies should actively respond to employees’ needs for self-development, choose a suitable online learning and training model, and plan a clear career path for employees.
From the perspective of corporate culture, managers should view the epidemic situation as an opportunity to strengthen the emotional connection of employees and enhance loyalty and cohesion. The survey shows that, compared with the four largest cities of Beijing, Guangzhou, Shenzhen and Guangzhou, the respondents in Hubei faced higher pressure, but they also showed higher corporate loyalty, reflecting respondents’ strong psychological resilience. In the face of this epidemic, respondents from small and medium-sized enterprises showed higher pressure and lower loyalty. Small and medium-sized enterprises should take advantage of their flexible and flat organization, communicate openly with employees, offer care packages and consolidate confidence.
One of the most important features of people’s response to stress is their fear for the disease and their expectations of uncertainties, which is a greater source of stress than fear itself. Therefore, how to help oneself and employees to improve their sense of control, becomes particularly important in this special period. It is not wise to escape and suppress stress and other negative emotions, rather we should actively face and accept the existence of stress. The sources of stress are varying and will not disappear, so stress management needs to be carried out quickly and in a timely manner.
Past research has revealed that, when conditions permit, the quickest and most effective way to reduce stress is to talk to someone close. We also found in the survey that those who have zero communication with family and/or friends have significantly higher levels of stress, anxiety and depression than other respondents, and their psychological resilience and corporate loyalty are also significantly lower than other respondents. This is because social neuroscientists have found that loneliness has a huge negative effect on life and work. Therefore, increasing positive communication and establishing links between people are very helpful to reduce stress. Health, as defined by the World Health Organization is “a state of complete physical, mental and social well-being and not merely the absence of disease or infirmity.” WHO research also tells us that close families, organizations, and community are related to all aspects of health, and these relationship bonds also herald a higher sense of well-being.
For enterprises, encouraging employees to establish these social relationships in different ways can help employees manage their stress levels. In this survey, we found that those who participated in public welfare activities showed the lowest degree of stress compared to other ways of reducing stress. Scientists have repeatedly found that altruism or helping others is an important way to establish good interpersonal relationships and is one of the most reliable ways to improve happiness. Since optimism and pessimism are both amplifiers of a sense of control, companies should not only enhance their employees’ happiness, but also help them increase cohesion in the process of leading employees to do public welfare together. Previous studies have shown that companies that aim to improve employees’ wellbeing will also reap better work efficiency and performance.
The last analysis article, Episode 5: Accelerating Recovery, of the survey series will also be published soon. This episode will focus on the distribution and differences of high and low resilience groups and review the important trends in various industries in the hope of helping inspire businesses on their way to business recovery.