This survey was led by Dr. Zhang Xiaomeng, Associate Professor of Organizational Behavior, Associate Dean for Executive Education and Co-Director of the Leadership and Motivation Research Centre at the Cheung Kong Graduate School of Business (CKGSB)
The COVID-19 pandemic has forced us to press pause on the Chinese economy, with companies now facing challenges on the issues of production and employment resumption. Now more than ever, it is vital that we work together to recover from losses while remaining vigilant to ongoing risks. Individual psychological resilience has a strong bearing on corporate resilience and the time it takes for the Chinese economy to bounce back. Whilst it goes without saying that a strong rebound is essential, the issue now is how to resume production and employment whilst ensuring risk is kept at bay.
This is part three of a survey series, examining how different factors affect individual psychological resilience and, in turn organizational resilience.
Overall conclusions
The survey finds that psychological resilience is negatively correlated to depression and anxiety; in addition, factors affecting psychological resilience include: gender, age, education, region, company size, seniority, working years, work resumption status, loyalty, satisfaction, stress and time management.
Companies should provide personalized psychological support and build organizational resilience with the knowledge of their employees’ individual psychological resilience.
1. Gender: Overall, both men and women show relatively high levels of psychological resilience, and scores for anxiety and depression are within normal ranges. The resilience of female leaders and executives is higher than that of their male counterparts.
2. Age: Psychological resilience is on average at its highest among respondents aged 40-59 (scoring 30.72 of 40), and at its lowest among 19-29 year old(28.75). With age, psychological resilience scores tend to increase and average scores for depression and anxiety follow a downward trend.
3. Education: The average score for psychological resilience increases with education level, while scores for depression and anxiety also increase with education level. The postgraduate and higher education group showed the highest level of anxiety (3.21 of a maximum of 21).
4. Region: Resilience of respondents from Hubei did not show significant differences from that of respondents working elsewhere in the country. Among the first-tier cities of Beijing, Shanghai, Guangzhou and Shenzhen, respondents in Beijing have the highest score for psychological resilience (30.55) and Shenzhen the lowest (28.83).
5. Size of company: Respondents from SMEs had the lowest level of psychological resilience and reported the highest levels of depression and anxiety.
6. Seniority and working years: There is a positive correlation between the company seniority, working years and psychological resilience. With an increase in seniority and working years, the score for psychological resilience rises. Employees who have worked in their company for more than 10 years have the highest score for psychological resilience (31.03). Respondents who worked for their company for less than a year have the lowest score for psychological resilience (29.09) and the highest scores for depression (4.19 out of a maximum of 27).
7. Industry: The highest average score for psychological resilience are in respondents from the agriculture/forestry/farming/fishing sectors (31.79). The lowest score are in respondents working in transportation/shipping/logistics/warehousing (27.83). The highest scores for depression are in respondents from the culture/media/entertainment/sports (4.61) industries, and the highest level of anxiety is in those working in education and training (3.95).
8. Layoffs, pay-cuts and working efficiency: In companies with greater numbers of layoffs and pay-cuts, respondents’ psychological resilience trends downwards, while depression and anxiety increases. As home office efficiency increases, respondents find their psychological resilience on the rise, and depression and anxiety levels are on the decline.
9. Loyalty: As respondents declare themselves less likely to switch jobs, their level of psychological resilience increases, and levels of depression and anxiety decrease.
10. As satisfaction with their company’s epidemic prevention measures, employee care package, level of communication with colleagues, and own work status increases, respondents register lower levels of stress, higher psychological resilience, and decreasing levels of depression and anxiety. Daily exercise and time spent chatting with friends and family is found to be positively correlated with psychological resilience.
Sample distribution and psychological condition (RDA)
In this questionnaire, we tested respondents’ psychological resilience, and levels of depression and anxiety (RDA).
The American Psychological Association (APA) defines psychological resilience as the process and outcome of successfully adapting to difficult or challenging life experiences, especially through mental, emotional, and behavioral flexibility and adjustment to external and internal demands.
Previous research has shown a negative correlation between psychological resilience and depression and anxiety. The results of this survey support this conclusion – the Spearman correlation coefficients for psychological resilience, depression and anxiety are -0.41 ** and -0.36 **, p is less than 0.01 (Note: the correlation coefficient values appearing in the text are marked **, p value less than 0.01 indicates a significant correlation). It means that with an improvement in psychological resilience, both depression and anxiety display a significant downward trend.
Full sample overview:
Before and after resuming work, our sample of 5,835 entrepreneurs and employees showed a high level of resilience, with an average psychological resilience score of 29.97 out of 40, and a standard deviation of 6.75. The higher the score, the better the resilience. In an earlier study of Chinese subjects, it was found that the average psychological resilience of ER medical staff was 28.9 points, and that of customer service staff was 26.5 points. The average psychological resilience level of earthquake survivors was 24.8 points, and that of women during pregnancy was 26.9 points.
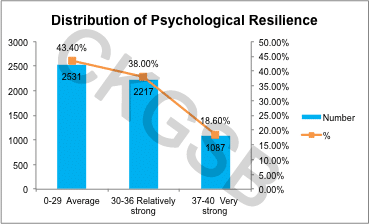
The survey data shows that 18.60% of the respondents (1,087 people) show very strong psychological resilience (ranging from 37-40), and 38% of respondents (2,217 people) show strong psychological resilience (ranging from 30-36). A total of 43.40% of respondents (2,531 people) showed average psychological resilience (ranging from 0- 29).
All samples’ distribution of the three levels of psychological resilience are shown below:
All samples’ distribution of the five levels of depression is shown as follows:

Respondents’ average levels of depression and anxiety were found to be within a normal range. The average depression score was 3.74 (with a range of 0-27) with a standard deviation of 4.10, and the average anxiety score 2.85 (with a range of 0-21) with a standard deviation of 3.64. Lower depression and anxiety scores indicate a lower likelihood of depression and anxiety.
The distribution of the whole sample at the four levels of anxiety is as follows:

1. Gender:
On average, men registered higher psychological resilience (30.64) than women (29.18 out of 40). The anxiety level of female respondents (2.97) was slightly higher than that of male respondents (2.75 out of a maximum value of 21), and the average level of depression among female respondents (3.97) was slightly higher than that of male respondents (3.55 out of a maximum of 27). Men and women as a whole showed relatively high levels of psychological resilience, with anxiety and depression scores within normal ranges. Female leaders and executives are more resilient than their male peers.
For an in-depth analysis of the gender perspective, please refer to Episode #2.
2. Age group:
The largest segment of survey respondents (38%) were aged 30-39 years old, followed by those aged 40-49 and those in the 19-29 age group, accounted for 22% and 21% respectively. Around 10% were aged 50-59 years old, and less than 1% were aged 60-69 years.
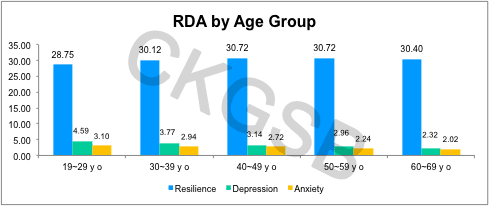
There is a positive correlation between age and psychological resilience. The Spearman correlation coefficient is 0.14 **, p value is less than 0.01. At the same time, age and depression and anxiety are negatively correlated. The Spearman correlation coefficients are -0.15 ** and -0.06 **, p is less than 0.01, indicating that with age, psychological resilience rises, and depression and anxiety levels fall.
Psychological resilience was highest among those in the 40-49 and 50-59 age groups, both being 30.72, and lowest in the 19-29 age group (28.75). However, average scores were highest for depression (4.59) and anxiety (3.10) among respondents in the 19-29 age group. For management, this suggests a need to pay more attention to the mental wellbeing of younger staff, focusing on how they experience pressure and build resilience.
3. Education:
42.07% of respondents had a bachelor’s degree; followed by around 31.35% with secondary and tertiary education; 15.25% with postgraduate education or above; and 11.33% with high school or below education.
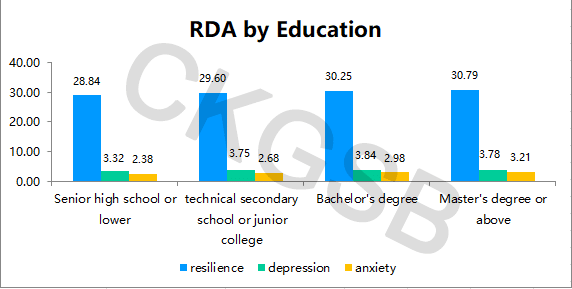
The survey data shows a positive correlation between educational levels and psychological resilience. The Spearman correlation coefficient is 0.07 **, and p is less than 0.01, that is, the score for psychological resilience increases as educational levels increase. There is also however a positive correlation between education, depression and anxiety. The Spearman correlation coefficients are 0.07 ** and 0.11 **, respectively, and p is less than 0.01, that is, depression and anxiety scores also increase with education levels. The anxiety score is the highest in the postgraduate and above group (3.21 of a maximum of 21). The bachelor’s degree group has the highest depression score, 3.84 (of a maximum of 27).
4. Region:
In terms of geographical distribution, the highest levels of psychological resilience were found in respondents from Hong Kong, Macau, Taiwan and overseas (31.84), and the lowest was in Central China (29.76). The highest level of depression by region was found from those in Western China (4.69), and lowest from those in Eastern China (3.61). The highest anxiety score was registered among respondents in Western China (3.95), and the lowest in Hong Kong, Macao and Taiwan and overseas (2.42). 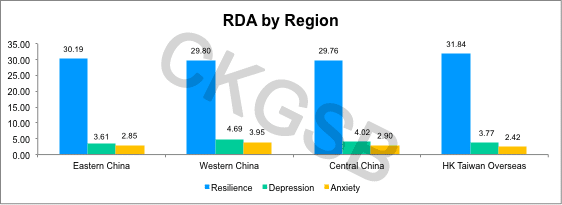
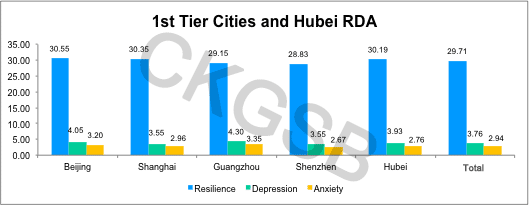
Among the four first-tier cities in Beijing, Shanghai, Guangzhou and Shenzhen, respondents in Beijing had the highest score on psychological resilience (30.55) and those in Shenzhen the lowest (28.83). The highest depression level was seen in Guangzhou (4.30), and the lowest in Beijing and Shanghai (both 3.55). For anxiety, Guangzhou was top of the list (3.35), and Shenzhen lowest (2.67). We paid particular attention to the respondents working in Hubei. The data did not show significant differences from those in other major cities. Indeed, their average resilience score was slightly higher than the sample as a whole, while anxiety was slightly lower than for the sample as a whole, and level of depression slightly higher than the average for the sample.
5. Size of enterprise (staff and revenue):
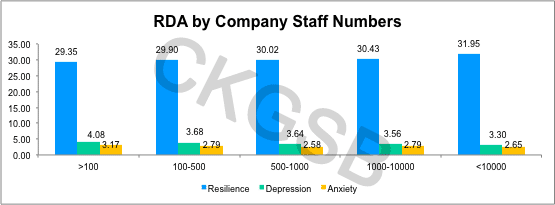
As the company size gets larger, average psychological resilience also increases. Companies with more than 10,000 employees registered the highest psychological resilience (31.95). Depression scores were negatively correlated with company sizes – the highest depression score is 4.08, found in companies with less than 100 staff, and the lowest of 3.30, for companies with more than 10,000 staff. The same trend was found for anxiety scores: the highest score was found in companies with fewer than 100 employees (3.17), and the lowest were in companies with more than 10,000 staff (2.65).
In terms of scale measured by revenue, a similar trend was found. The greater the revenue of the respondent’s company, the greater that individual’s psychological resilience, and the lower the level of depression (except for the RMB 50-100 million group). The highest anxiety score was found in those from companies with revenues of less than RMB 10 million (3.39), and the lowest in companies earning more than RMB 1 billion (2.52).
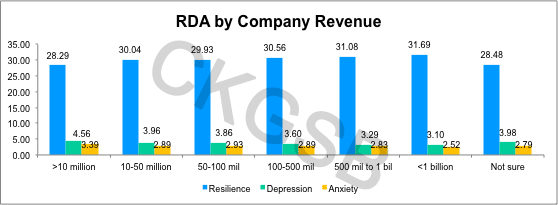
To conclude, SME entrepreneurs and employees have the lowest levels of psychological resilience and the highest scores for depression and anxiety. It is also worth noting that respondents who did not know their company’s revenue showed relatively low levels of psychological resilience (28.48) and high levels of depression (3.98).
6. Type of company
Respondents working in foreign and private enterprises were found to have the highest levels of resilience (both 30.14), and the highest levels of depression and anxiety were found in those from non-profit organizations (5.65 and 4.47 respectively). This partly reflected the condition that non-profit organizations face severe challenges and pressures during the epidemic.

7. Seniority
There is a positive correlation between seniority and resilience. The Spearman correlation coefficient is 0.18 **, and p is less than 0.01, indicating that the further up the corporate ladder, the higher the resilience score of the respondent.
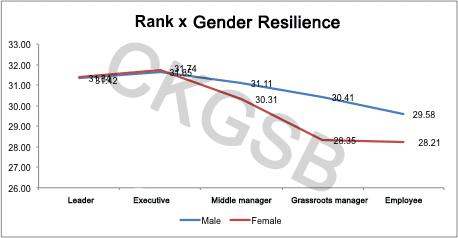
From the perspective of ‘gender and seniority’, the psychological resilience of female leaders and executives is higher than that of men of the same seniority. Male middle managers, grassroots managers and regular employees have higher levels of psychological resilience than female peers. The level at which the largest difference in psychological resilience between the sexes is recorded, is in grassroots managers, with men averaging 30.41 and women 2.06 points lower, at 28.35.
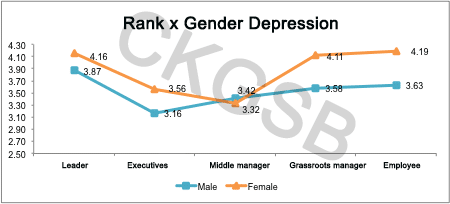
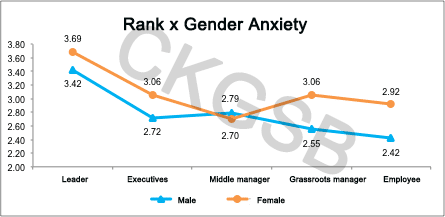
Except for middle managers, the average depression score for women in all ranks was higher than that of men. The highest score for depression was among female regular employees (4.19), and the lowest score was among male executives (3.16). Except for middle managers, the average anxiety score for women of all ranks (3.69) was higher than that of men (2.42). Most anxious of all respondents were female leaders (3.69), while male regular employees were least anxious, scoring 2.42.
8. Years of employment:
The number of years a respondent has worked in their company has a positive correlation with psychological resilience, with the Spearman correlation coefficient at 0.10 ** and p less than 0.01. Years of employment has a negative correlation with depression with the Spearman correlation coefficient at -0.05 ** and p less than 0.01, This means that as the number of working years increases, psychological resilience rises and depression falls.
As can be seen from the graph below, employees with 10 years of experience in their company have the highest psychological resilience score (31.03), and those who have served under a year have the lowest psychological resilience score (29.09) and highest depression score (4.19). Firms should focus on depression among new employees and anxiety among employees with 5-10 years’ service.

9. Industry:
The top five industries represented in this survey are real estate, internet, production/processing/manufacturing, the financial sector, medical treatment/health care, and services. The highest level of psychological resilience was found in the real estate industry (30.69), and the lowest in medical treatment/healthcare (29.61)
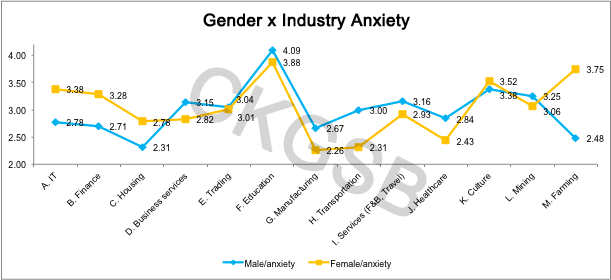
Ranked according to the average score of industries’ psychological resilience, agriculture/forestry/farming/fishing (31.79) have the highest resilience score and transportation/shipping/logistics/warehousing (27.83) scored the lowest in resilience. The highest average score for depression was in culture/media/entertainment/sports (4.61); the highest anxiety score was found in education and training (3.95), reflecting the varying impact of the epidemic on employees in different sectors.

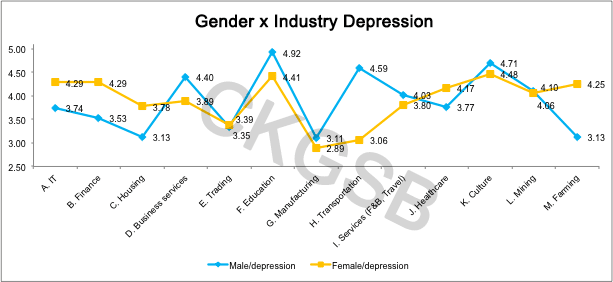
Considering the combination of gender x industry, those with the highest psychological resilience scores were men working in agriculture/forestry/farming/fishing (32.66), and at the other end of the scale were women in transportation/shipping/logistics/warehousing (26.50). As for depression and anxiety, men working in education and training scored highest (4.92 and 4.09 respectively).

Psychological resilience at the intersection of corporate seniority x industry:
At leadership level, the highest levels of psychological resilience were found among leaders in the internet sector (33.04), and the lowest were among leaders in agriculture/forestry/farming/fishing (29.67). For senior executives, those with the highest scores worked in medical treatment /health care (32.35), and the lowest in education and training (29.42). Middle managers scored highest for resilience in real estate (32.42) and lowest in transportation/shipping/logistics/warehousing (27.89). For grassroots managers, the highest scores were in farming (31.71) and the lowest were in transportation/shipping/logistics/warehousing (23.22). For regular employees, highest scorers worked in energy/mining/environmental protection (31.68), and lowest scorers in business services (26.70).

Note: blue background highlights the highest in the specific seniority among all industries and yellow background highlights the lowest.
Work Resumption and Psychological Condition (RDA)
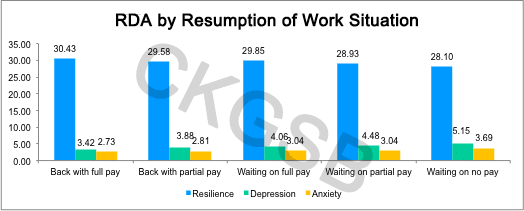
1. Work resumption degree has a negative correlation with psychological resilience, with the Spearman correlation coefficient being -0.10 ** and p less than 0.01. It has, however, a positive correlation with depression, with the Spearman correlation coefficient at 0.11 ** and p less than 0.01. This means that from “returning to work on full pay” to “no work and no pay”, the level of psychological resilience showed a downward trend and depression showed an upward trend. The figure shows that the respondents “returning to work on full pay” have the highest level of psychological resilience (30.43), and lowest levels of depression (3.42) and anxiety (2.73). Those with “no work and no pay” registered the opposite. They had the lowest level of psychological resilience (28.10) and highest level of depression (5.15) and anxiety (3.69). Therefore, to improve resilience and reduce depression and anxiety, companies should resume work or partially resume work in whatever way is possible (including remote working).
2. View on annual corporate performance has a negative correlation with psychological resilience with the Spearman correlation coefficient at -0.20 ** and p less than 0.01, a positive correlation with depression with the Spearman correlation coefficient at 0.19 ** and p less than 0.01, and has a positive correlation with anxiety with the Spearman correlation coefficient of 0.18 ** and p less than 0.01. It shows that for those expecting lower corporate performance goals, psychological resilience is reduced, while levels of depression and anxiety are heightened. Specifically, respondents who expect their companies to exceed pre-outbreak performance expectations show the highest levels of psychological resilience (31.90) and the lowest levels of depression (2.65) and anxiety (2.0). Respondents who expect their companies will reach less than 20% of the performance goals showed lowest levels of psychological resilience (26.89) and the highest levels of depression (5.96) and anxiety (4.47).

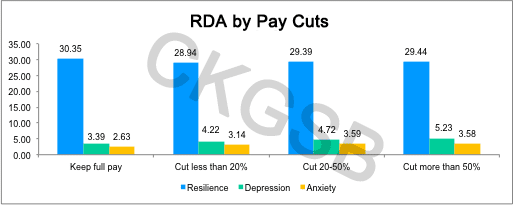
3. Pay cuts were found to have a negative correlation with psychological resilience with the Spearman correlation coefficient of -0.10 ** and p less than 0.01, a positive correlation with depression, with the Spearman correlation coefficient of 0.13 **, and p less than 0.01, and a positive correlation with anxiety with Spearman’s correlation coefficient of 0.10 ** and p less than 0.01. It shows that the higher the pay cuts, the lower the level of psychological resilience and the higher the levels of depression and anxiety.
4. The layoff ratio has a negative correlation with the sample’s psychological resilience, with a Spearman correlation coefficient of -0.09 ** and p less than 0.01. Layoffs at the company are positively correlated with depression, with the Spearman correlation coefficient of 0.12 **, and p less than 0.01. It is also positively correlated with anxiety, with the Spearman correlation coefficient of 0.13 ** and p less than 0.01. It shows that as the proportion of layoffs in the company increases, the level of psychological resilience shows an upward trend and the level of depression and anxiety increase.

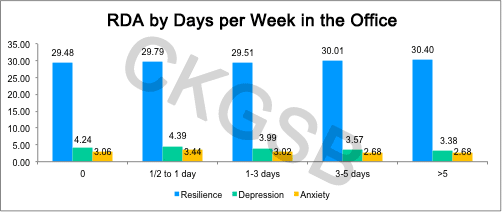
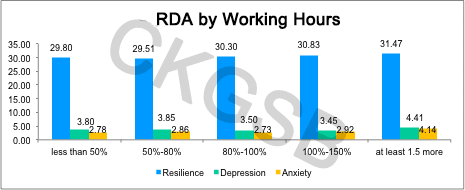
5. Respondents’ office time has a positive correlation with psychological resilience, with the Spearman correlation coefficient of 0.07 ** and p less than 0.01. It is negatively correlated with depression, with the Spearman correlation coefficient of -0.11 **, and p less than 0.01. It also has a negative correlation with anxiety. The Spearman correlation coefficient is -0.06 **, and p is less than 0.01. It shows that as hours at work increase, psychological resilience rises and depression and anxiety fall.
6. During the survey period, due to the impact of the epidemic, working from home was the new normal. We compared “working hours at home” and “working hours at the office.” The data shows that those with highest levels of resilience “work more than 1.5 times longer at home than in the office” (31.47), but it is also important to note that depression and anxiety levels are also highest for this group (4.41and 4.14 respectively).
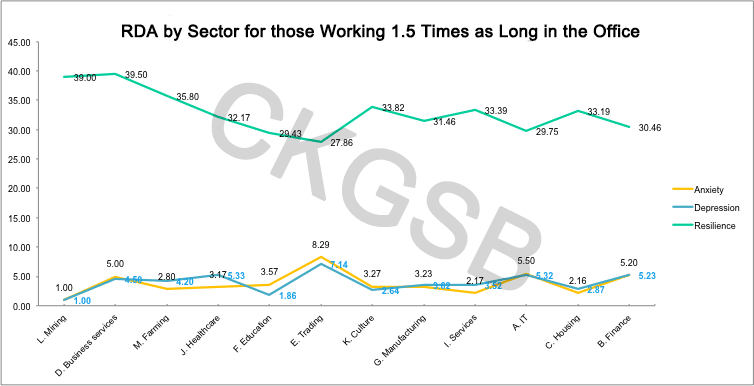
Analyzing the sectors for which “1.5 times or more” gives some significant information. We find highest psychological resilience among those working in business services, with 39.50 out of a maximum of 40 points. The sectors with lowest level of psychological resilience and highest levels of depression and anxiety are trade/wholesale/retail/leasing (27.86, 7.14 and 8.29 respectively).
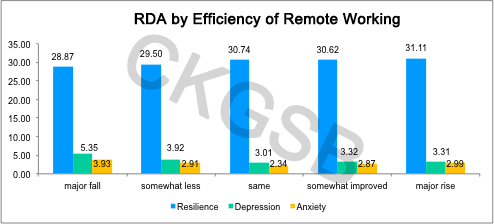
7. Home working efficiency has a positive correlation with psychological resilience, with the Spearman correlation coefficient of 0.12 ** and p less than 0.01, and is negatively correlated with depression, with the Spearman correlation coefficient of -0.18 ** and p less than 0.01. Home working efficiency is also negatively correlated with anxiety, with a Spearman correlation coefficient of -0.12 **, and p less than 0.01. This shows that as home working efficiency increases, psychological resilience increases and levels of depression and anxiety fall.
Salary expectations, Loyalty and Psychological Condition (RDA)
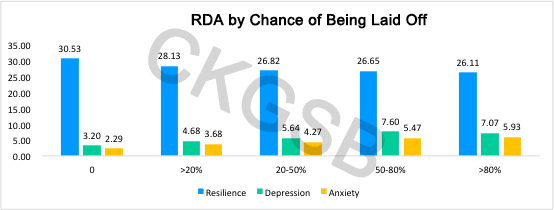
1. The possibility of being laid off has a negative correlation with psychological resilience, with the Spearman correlation coefficient of -0.20 ** and p less than 0.01. It has a positive correlation with depression, with the Spearman correlation coefficient of 0.13 ** and p less than 0.01, and a positive correlation with anxiety, with the Spearman correlation coefficient of 0.10 **, and p less than 0.01. This shows that as a respondent’s chances of being laid off increases, their psychological resilience decreases and their levels of depression and anxiety heighten. Those who did not think their job was in danger of being terminated had the highest level of psychological resilience (30.53) and lowest levels of depression (3.20) and anxiety (2.29). Those who felt their chance of being laid off was 80% or more had the lowest level of psychological resilience (26.11).
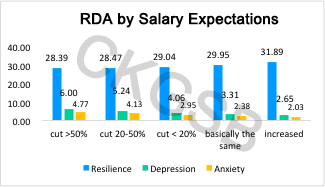
2. Attitude towards salary cuts and bonuses had a negative correlation with psychological resilience, with the Spearman correlation coefficient of -0.18 ** and p less than 0.01, and a positive correlation with depression with the Spearman correlation coefficient of 0.12 ** and p less than 0.01. It also has a positive correlation with anxiety, with the Spearman correlation coefficient of 0.08 ** and p less than 0.01. These correlations show that as salaries and bonuses fall, the level of psychological resilience falls and depression and anxiety rise. As shown in the figure, respondents who expect more than 50% less compensation had the lowest level of psychological resilience (28.39), and the highest levels of depression (6.00) and anxiety (4.77).
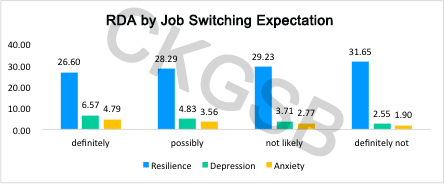
3. Expectations regarding job switching has a negative correlation with psychological resilience with the Spearman correlation coefficient of -0.13 ** and p less than 0.01. It had a positive correlation with depression with the Spearman correlation coefficient of 0.23 ** and p less than 0.01. It is also positively related to anxiety, with the Spearman correlation coefficient of 0.22 ** and p less than 0.01. It shows that with decreasing expectations to switch jobs, psychological resilience grows, and depression and anxiety levels fall.

4. Regarding loyalty (leaders were excluded from this survey question; highest score 30), it is positively correlated with psychologica

