


The Causes of the Recent Renminbi Depreciation
June 01, 2022
Dr. Li Haitao – Dean’s Distinguished Chair Professor of Finance at Cheung Kong Graduate School of Business
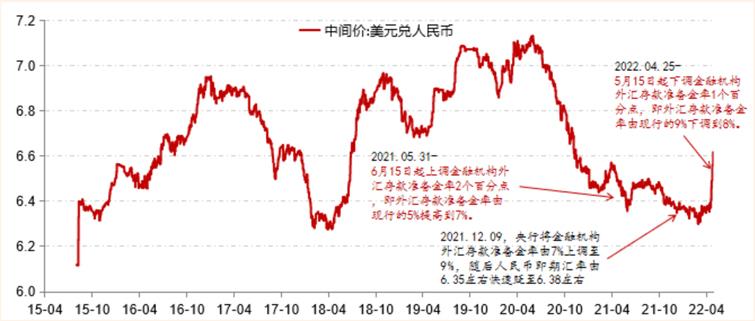
Since April 2022, the renminbi exchange rate has depreciated sharply, from 6.4 to 6.6 to the dollar. To mitigate further depreciation, the People’s Bank of China (PBOC) announced on May 15 that it would cut the reserve requirement ratio (RRR) on foreign currency deposits by 1 percentage point to 8%. This is the first time the PBOC has lowered RRR on foreign currency deposits after raising it twice in 2021 during a period of appreciation.
The rapid depreciation of the renminbi can be attributed to three factors: 1) Lockdowns in China since March 2022 which have led to a significant drop in exports. 2) A rise of the U.S. dollar index under Fed interest rate hikes. 3) An increase in demand for the U.S. dollar as a safe-haven asset due to uncertainties over the Russia-Ukraine war.
Lockdowns in China Cause Disruptions to Manufacturing and Services
The renminbi exchange rate is likely to depreciate further into the first half of 2022 due to the strength of the dollar and lockdowns in China. After lockdowns were imposed in China, capital started to flow out of the country which placed downward pressure on the economy. Since the end of 2021 through to the outbreak of the Russia-Ukraine war on February 24, 2022, the dollar and the renminbi followed a similar trend – at that time stable production in China and its large trade surplus kept the renminbi strong. But when Shanghai and Shenzhen went into lockdown in March 2022, the economy took a downturn and expectations for economic recovery faded.
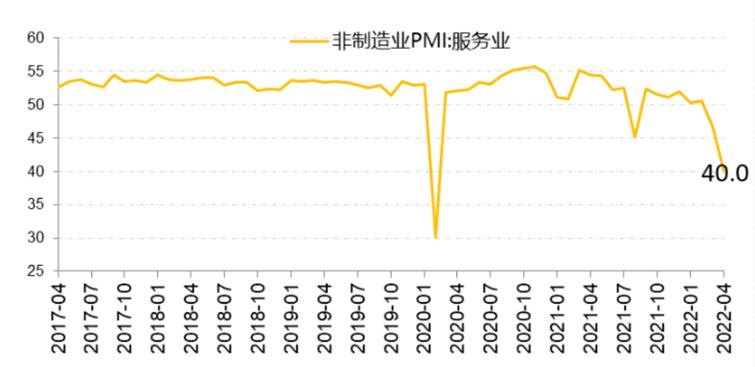
Looking at data from China’s Price Manufacturing Index (PMI) – as well as the operating rates of industrial enterprises, property sales, and electricity and travel consumption – it is evident that China’s economy is under downward pressure. In April 2022, the National Bureau of Statistics of China recorded a manufacturing PMI of 47.4, down 2.1 percentage points from March 2022 (it was also the lowest recorded over two consecutive months since March 2020). Additionally, in April 2022, China’s non-manufacturing PMI was only 41.9 which was much lower than expected. Therefore, Covid-19 has had a significant impact on both manufacturing and services in China.
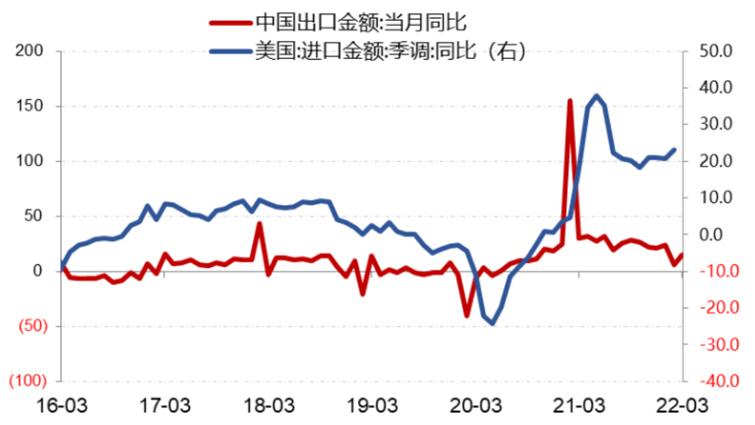
Up until March 2022, China’s year-on-year exports growth rate was higher than anticipated: exports totaled USD $276.1 billion, a year-on-year increase of 14.7%, China’s trade surplus was USD $47.4 billion and foreign exchange settlement and bank sales was USD $30.6 billion. However, this reversed in April after lockdowns caused negative growth rates. Demand for cross-border renminbi settlement has also been hit by the reduction in exports.
A decline in exports has been exacerbated by the Federal Reserve’s monetary tightening policy and the resumption of manufacturing overseas. Countries which previously relied on Chinese exports have found replacements in other markets such as Vietnam and South Korea.
Fed Rate Hikes
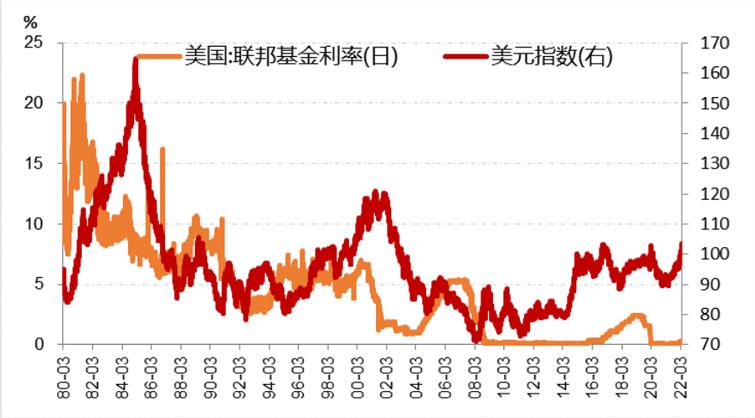
Federal Reserve interest rate hikes are a key factor when it comes to renminbi depreciation. The Fed is facing its most severe inflation crisis in 40 years and is implementing its most aggressive monetary tightening policy since the 1980’s Paul Volcker era. There are expected to be eight Fed interest hikes in 2022. By the end of 2022, the federal funds rate could reach 2.6%.
The Federal Reserve is also planning to shrink its USD $9 trillion balance sheet (before the pandemic, its balance sheet was only USD $4 trillion). Such large-scale interest hikes and shrinking of the balance sheet will strengthen the dollar and lead to a volatile market.
On April 28, the U.S. Dollar Index reached a 20-year high, peaking above the December 2016 high of 103.82. This is significant because markets have not witnessed such a strong dollar environment in 20 years.
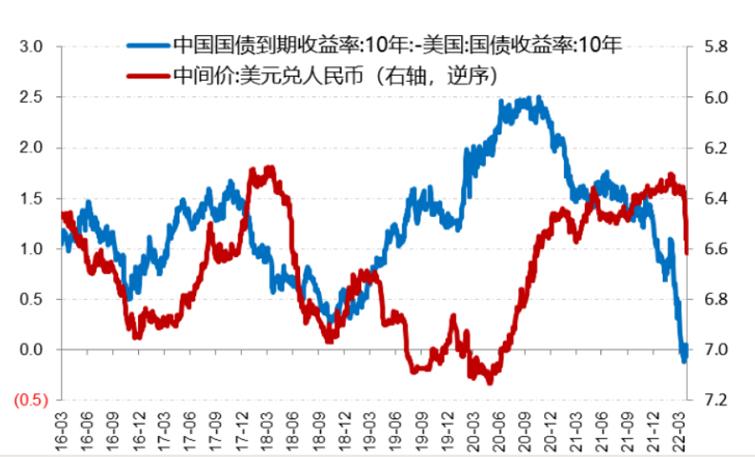
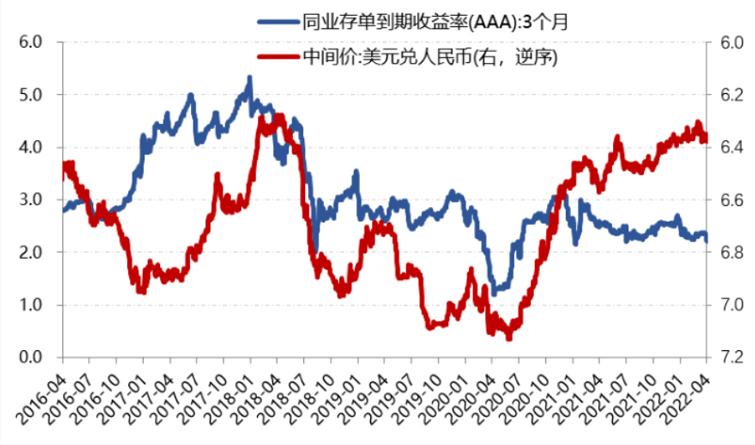
Since April, under its interest hike cycle, the U.S.-China interest rate gap has narrowed to close to zero, putting further pressure on renminbi depreciation.
The market is already aware that the Fed’s hawkish attitude may bring about volatility in risk assets. U.S. stocks and bonds have fallen rapidly since the beginning of 2022: The Nasdaq composite has experienced its largest drop since 2008, while U.S 10-year treasury yields have hit a high close to 3.0%. It is expected that the sell-off of U.S stocks and bonds will not end until inflation settles down or U.S stocks fall further than expected.
A Crisis in Europe
Although the dollar has gained strength following the risk aversion after the Russia-Ukraine war broke out, the conflict has significantly weakened the euro. High energy prices have harmed its manufacturing industry, and such a conflict on its own turf could bring Europe into an era of economic stagflation.
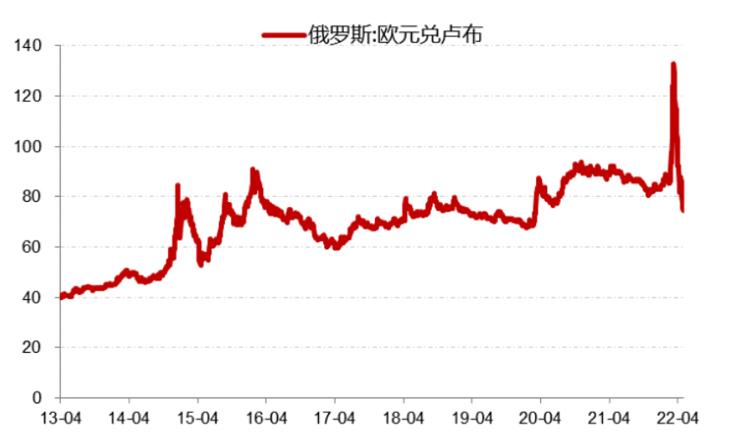
On April 28, the euro was not far off from a 20-year low at 1.047 against the dollar. After Putin enforced ruble payments for gas, the ruble has almost recovered all of its losses, which has further decreased demand for the euro. In general, the Russia-Ukraine conflict has had a harmful effect on the currencies of manufacturing-based economies while benefitting resource-based economies.
The Yen Depreciates as the Bank of Japan Sticks to its Large Fiscal Stimulus Program
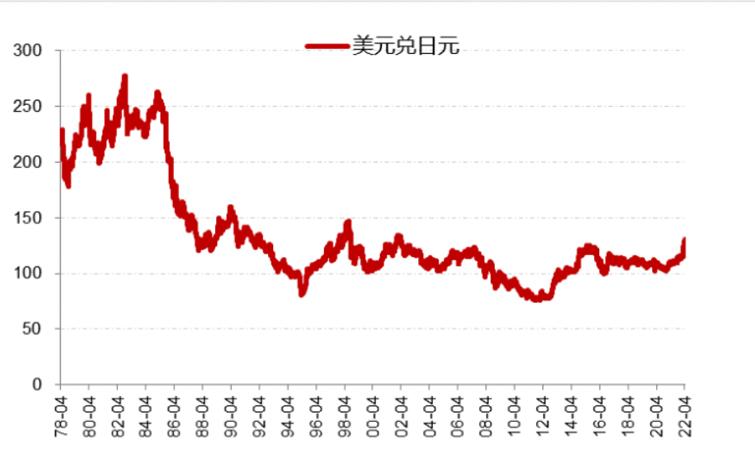
Another currency in the U.S Dollar Index to experience unprecedented depreciation is the Japanese Yen. On April 28, the Yen hit ¥131 to the dollar, its largest decline in 20 years. Possible further depreciation could also occur and reach 150-200 yen to the dollar.
One of the reasons for this is the vastly different approaches of the two central banks. On April 28, the Bank of Japan announced its commitment to a large fiscal stimulus package, promising to continue its 10-year government bond purchasing program and keep its 10-year bond yield target at 0%, and the deposit interest rate unchanged at -0.1. Unlike the United States and other countries which have raised rates and halted bond buying, the Bank of Japan has maintained its policy which has led to depreciation of the yen.
China is a large importer of energy and raw materials which exposes the renminbi to the same depreciation pressure which the Japanese yen and the Korean won are experiencing. In 2021, China’s dependence on foreign oil was 72%, and gas 43%. With energy prices and import costs increasing, as well as lockdowns halting China’s exports, the renminbi has succumbed to depreciation.
The current conflict in Ukraine shows no obvious sign of improvement, particularly due to intense fighting in Mariupol. Gas supplies to Bulgaria and Poland have been cut off due to them refusing to pay Russia in rubles for gas. The EU spot price for natural gas is currently more than 20 USD/MMBtu (last year in the same period it was only 4-8 USD/MMBtu). With high energy prices, capital is flowing out of Europe, China, and other manufacturing countries.
The Inflection Point
Although depreciation pressure on the renminbi is strong, there will likely be an inflection point when China’s manufacturing industry returns to normal, and when Fed interest hikes start to break the U.S. economy. However, it might take until at least the third quarter with key events such as China’s 20th Party Congress and the U.S. midterm elections.
There are both pros and cons to renminbi depreciation, however the magnitude of this depreciation depends largely on the PBOC. To a certain extent, steady depreciation can benefit exports and is conducive to the PBOC’s two-way fluctuation path (appreciation and depreciation). If the USD/RMB exchange rate stays within the range of 7.0, it will be acceptable to the PBOC.
Since interest rates are strongly related to an economy’s production capacity and the policies of the central bank, under the current cycle of depreciation it is difficult to prevent interest rates from rising. While lower interest rates often lead to an outflow of capital and currency depreciation, in a stable economy where interest rates are rising the exchange rate also tends to rise. Presently, with the Chinese economy showing no signs of improvement, interest rates have fallen along with renminbi depreciation.
China’s Current Easy Money Policy vs 2018 Deleveraging
It should also be highlighted that the depreciation the renminbi is experiencing now is different to that of 2018. At that time, China was in the middle of a trade war with the United States and implemented a deleveraging policy – reducing its debt by tightening monetary policy. Today, trade frictions have eased to some extent – on March 23, the Office of the U.S. Trade Representative announced that it would reinstate 352 expired product exclusions from U.S. “Section 301” tariffs on Chinese imports. China is implementing a looser monetary policy, and once lockdowns are eased its A-shares will start to show greater resilience than in 2018.
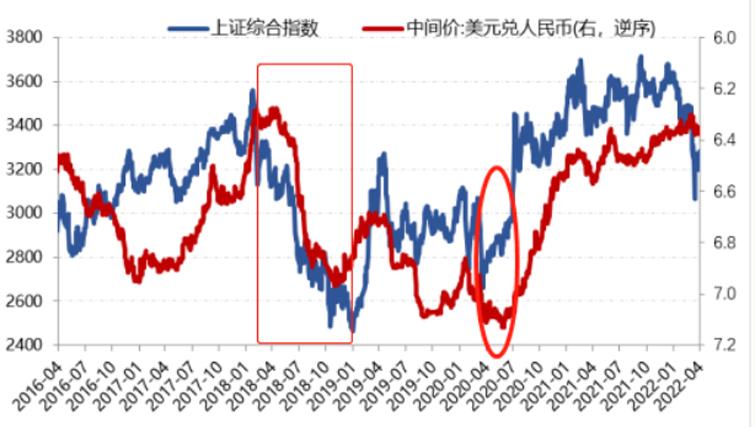
China’s A-shares have already hit rock-bottom and are becoming increasingly a cost-effective choice. The spread between shares on the Shanghai and Shenzhen stock exchanges and corporate bonds is at its highest level since 2018, which means that the price-to-earnings ratio of these companies is lower enough to generate high yields and outperform corporate bonds.
Enjoying what you’re reading?


Related Articles


Our Programs

Global Unicorn Program: Scaling for Success in the Age of AI
In partnership with Stanford Engineering Center for Global & Online Education
Global Unicorn Program Series
This CKGSB program equips entrepreneurs, intrapreneurs and key stakeholders with the tools, insights, and skills necessary to lead a new generation of unicorn companies.
LocationStanford University Campus,
California, United States
Date29 Sep - 03 Oct, 2025
LanguageEnglish with Chinese Translation

Emerging Tech Management Week: Silicon Valley
In partnership with UC Berkeley College of Engineering
Global Unicorn Program Series
This program equips participants with proven strategies, cutting-edge research, and the best-in-class advice to fuel innovation, seize emerging tech developments, and catalyse transformation within your organization.
LocationUC Berkeley
Date02 - 07 Nov, 2025
LanguageEnglish

Asia Start: AI + Digital China Expedition
Asia Start provides entrepreneurs and executives with unparalleled access to Asia’s dynamic digital economy and its business ecosystems, offering the latest trends and insights, strategies, and connections to overcome challenges and unlock future growth for your business in Asia and beyond.
LocationShanghai, Hangzhou, Guangzhou, Shenzhen
Date17 - 21 Nov, 2025
LanguageEnglish

Smart Cities, Fintech, and Alternative Energy for the Global Future
In partnership with Columbia Engineering
Global Unicorn Program Series
This program is a transformative initiative designed to empower civil leaders and businesses in smart city development, fintech, alternative energy, and new energy sectors.
LocationDubai, UAE
Date15 - 19 Dec, 2025
LanguageEnglish

Opportunities in the Disruption of Traditional Industries
In partnership with The University of Sydney
Global Unicorn Program Series
The Global Unicorn Program in Disruption of Traditional Industries – presented jointly by CKGSB and University of Sydney – will emphasize Australia’s distinctive contributions.
LocationSydney, Australia
Date24 - 27 Feb, 2026
LanguageEnglish

AI-Driven Healthcare Innovation Program
In partnership with Johns Hopkins Carey Business School
Global Unicorn Program Series
The 2025 Artificial Intelligence (AI)-Driven Healthcare Innovation Program stands at the forefront of addressing the critical need for innovative healthcare solutions powered by artificial intelligence.
LocationJohns Hopkins University, Washington, D.C.
DateSummer 2026