


This survey was led by Dr. Zhang Xiaomeng, Associate Professor of Organizational Behavior, Associate Dean for Executive Education and Co-Director of the Leadership and Motivation Research Centre at the Cheung Kong Graduate School of Business (CKGSB)
The COVID-19 pandemic has forced us to press pause on the Chinese economy, with companies now facing challenges on the issues of production and employment resumption. Now more than ever, it is vital that we work together to recover from losses while remaining vigilant to ongoing risks. Individual psychological resilience has a strong bearing on corporate resilience and the time it takes for the Chinese economy to bounce back. Whilst it goes without saying that a strong rebound is essential, the issue now is how to resume production and employment whilst ensuring risk is kept at bay.
In part one of the series, Survey #1- Work Choices: The Game of Survival and Confidence, the results revealed an important component of entrepreneurial leadership and organizational capabilities: resilience. The ability to recover and rebound after a period of adversity is key to the long-term survival and success of a company. Adversity is both a test and experience of resilience. The more severe the adversity, the more difficult the organizational choices faced, and the greater the resilience an organization develops.
This is the second survey of our series, focused on the issue of mental resilience for entrepreneurs and employees both before and after the resumption of work. The aim is to build a detailed picture of the situation in different industries, types and sizes, so as to help organizations and employees improve their resilience to enable the economy to regain its original vitality. The survey found higher levels of resilience, optimistic expectations, low and medium levels of stress, relatively high levels of satisfaction and relatively high levels of loyalty.
This survey was filled out anonymously by CKGSB students, alumni as well as employees in alumni-led companies. A total of 5,835 valid questionnaires were collected in three days, providing 507,732 data points.
Overall Conclusions
1. Psychological conditions
At the time of returning to work, the 5,835 business owners and employees who responded to our survey showed a high level of resilience. The average sample’s psychological resilience score was 29.97 on a range of 0-40, with a standard deviation of 6.75. Average anxiety and depression levels were within a normal range. The average anxiety score was 2.85 on a range of 0-21, with a standard deviation of 3.64. The average depression score was 3.74, on a range of 0-27, with a standard deviation of 4.10.
2. Returning to work
As of the end of February, 90% of respondents’ companies have resumed work in full or in part (including telecommuting). Regardless of whether or not they had already resumed work, 68% of respondents kept paying employees full salaries. The proportion of people returning to work with full pay was around 60%. More than two-thirds of respondents’ companies did not cut salaries, and 84% of companies laid off zero staff. The survey results for returning to work expectations and salary reductions are relatively consistent with the results of Survey #1- Work Choices- The Game of Survival and Confidence.
3. Business performance expectations
Most respondents believe company annual performance will suffer to some extent. 77% of respondents believe that their company will perform at least 70% as well as expected prior to the outbreak, of which 10% believe that their company will outperform pre-outbreak expectations. The sectors at the top of this list are finance (17.85%), real estate (15.82%), and the internet (14.48%).
4. Working hours and efficiency
The vast majority of respondents have, to varying degrees, been working fewer hours than before the outbreak. Nearly half have been working less than 50% of pre-outbreak hours. More than half reported a somewhat diminished efficiency of working from home.
5. Job satisfaction
88.5% of respondents were satisfied or very satisfied with their employer’s epidemic prevention measures and 85% registered satisfaction or high satisfaction with their company’s care package. About 68% of those were highly satisfied with their work status, and 75.5% were very happy with communication between colleagues.
6. Stress situation
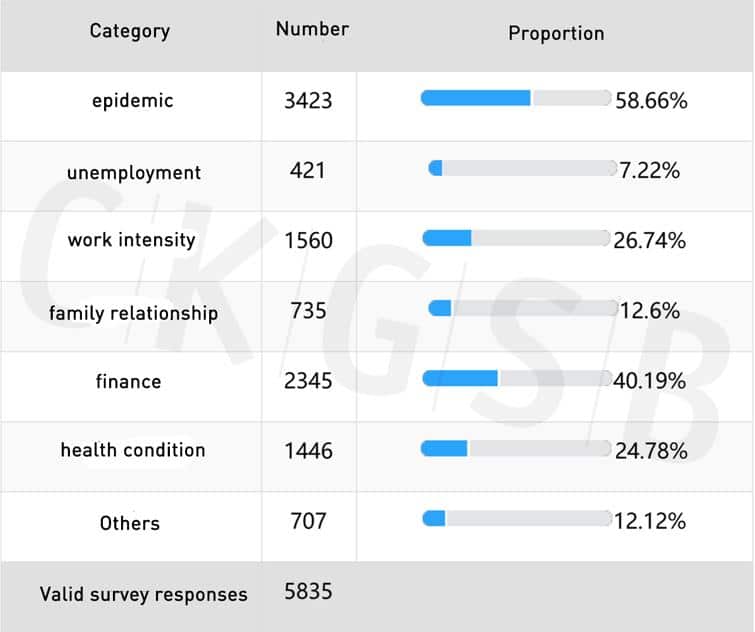
More than 70% of respondents believe that they are currently under moderate or below moderate levels of stress. The main sources of stress are the epidemic (58.66%), finances (40.19%), and work intensity (26.74%).
7. Salary expectations
72.21% of respondents believe that they will not be laid off, and their own judgment on the possibility of being laid off has a strong negative correlation with seniority in the company. 51.89% of respondents think that their annual income will be flat, and 11.45% think it will increase.
8. Loyalty
More than 70% of the respondents believe that they are unlikely to or will definitely not switch companies after the epidemic. Except for top leadership (as top leaders did not need to answer this question on employee loyalty), the loyalty of the entire sample is relatively high, with an average score of 25.24 out of a maximum of 30.
Sample distribution
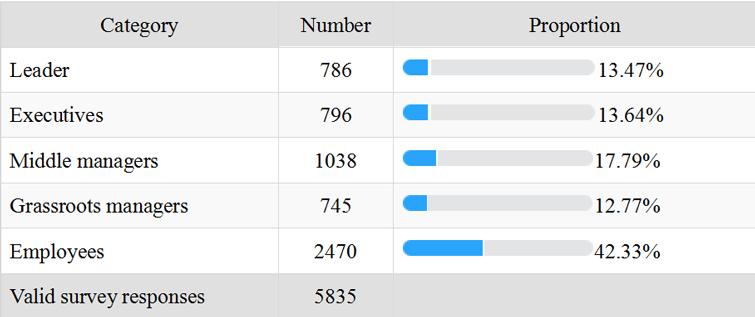
1. Seniority: Top leaders made up 13.64% and executives made up 13.64% of the sample, totally 1,582 respondents. Middle managers accounted for a relatively high proportion: 17.79% and junior managers accounted for about 12.77%. Employees made up the biggest proportion: 42.33% of the total.
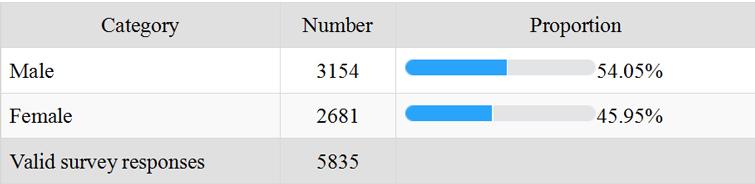
2. Gender: 54.05% of respondents were male and 45.95% female. The gender ratio is 117.6 (women set as 100), which is higher than the 2018 national population gender ratio of 104.64.
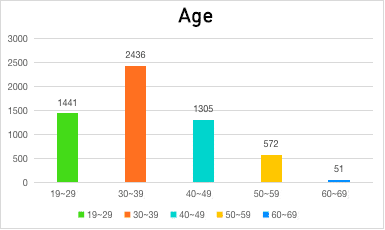
3. Age: Most respondents were aged 30-39, accounting for about 38%, followed by the 40-49 and 19-29 age groups, accounting for 22% and 21% respectively, and the 50-59 age group at around 10%. Less than 1% were aged 60-69.
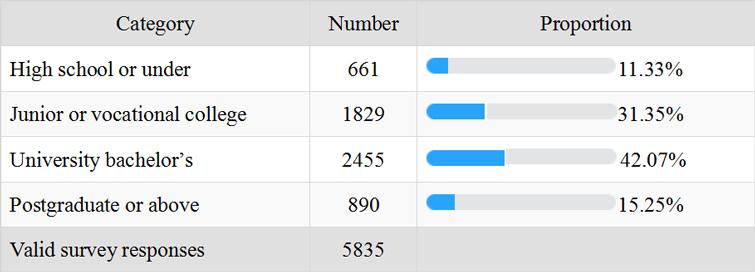
4. Education: 42.07% were educated to Bachelor’s degree level, followed by those to secondary or junior college level, accounting for about 31.35%. Postgraduates and above accounted for 15.25%, while those with high school diplomas or less accounted for around 11.33%.
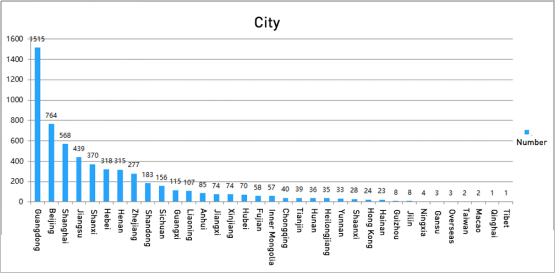
5. Geography: Most respondents worked in Guangdong province (1515 people), followed by Beijing with 764 people, Shanghai with 568 people, Jiangsu with 439 people, Shanxi, Hebei, and Henan all with more than 300 people, Zhejiang with 277 people, and Shandong, Sichuan, Guangxi, and Liaoning with less than 100 people. A total of 70 respondents worked in Hubei province.
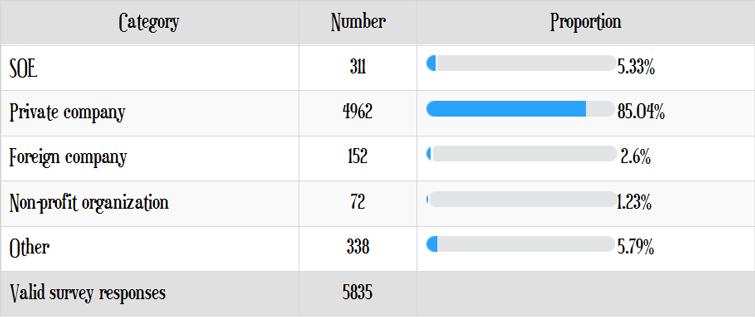
6. Type of company: More than 85% of respondents worked in private enterprises. The proportion of respondents from state-owned enterprises and other types of enterprises was 5.33% and 5.79%, respectively. Foreign companies and non-profit organizations accounted for relatively few respondents: 2.6% and 1.23% apiece.
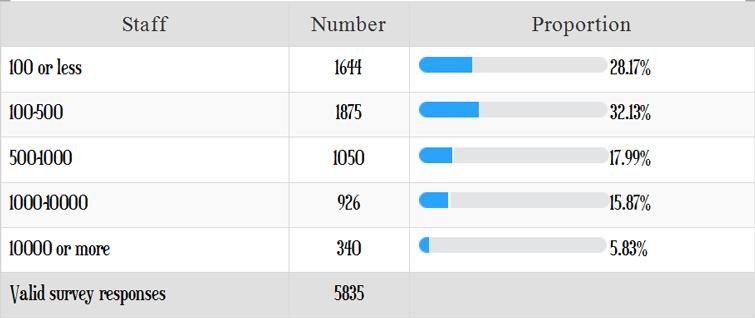
7. Company size: Respondents from small and medium-sized enterprises accounted for a relatively high proportion in the sample. About 60.3% of the respondents were from companies with less than 500 employees. Among them, companies with 100-500 employees accounted for the highest proportion, 32.13%. Respondents from companies with less than 100 employees accounted for about 28.17%, while those with 500-1000 employees accounted for 17.99%, Companies with 1000 to 10,000 staff and more than 10,000 comprised 15.87% and 5.83% of the sample respectively.
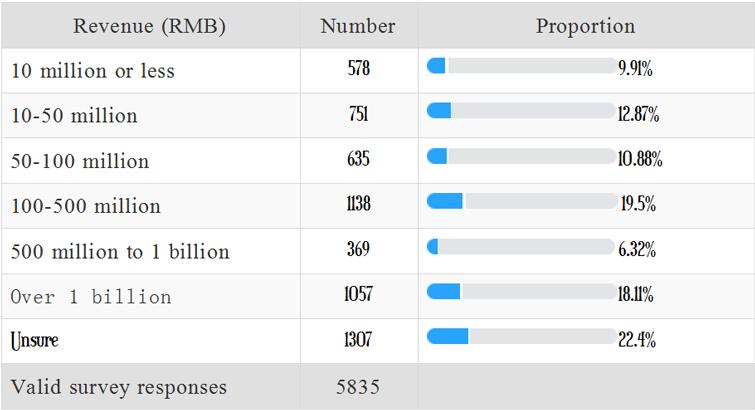
8. Company revenue: 19.5% of respondents worked in companies earning RMB 100 million to RMB 500 million; 18.11% for companies earning more than RMB 1 billion; companies between RMB 10 million and RMB 50 million, between RMB 50 million and RMB 100 million, and under RMB 10,000 are between 10% and 13%; those with revenue of RMB 500 million to RMB 1 billion make up the smallest proportion, at 6.32%. More than 20% of respondents are not aware of the annual revenue of the companies they work for.
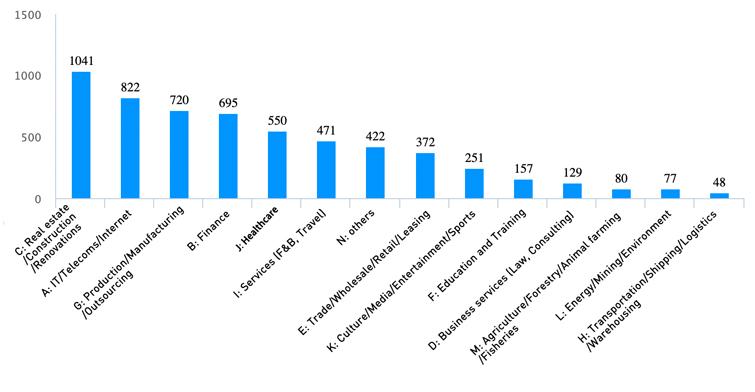
9. Industry: The highest proportion of respondents come from real estate, internet, production/processing/manufacturing, financial sector, medical care/health care, and services.
Going back to work
1. Pay status
The proportion of people returning to work with full pay was around 60%. Among the 5,835 survey respondents, 3,453 respondents returned to work with full pay, accounting for nearly 60% of the total sample. For the others, their personal work statuses were:
Returning to work with partial salaries (1,013 respondents, accounting for 17.36%), partial salaries while remaining on hold (546 respondents, accounting for 9.36%), full pay for work while remaining on hold (515 respondents, accounting for 8.83%), and no pay for work while remaining on hold (308 respondents, accounting for 5.28%).
After analysis, we found that whether or not they had returned to work, 68% of respondents were on full pay. This is in line with the results of Survey #1 in which, of the 1,112 companies surveyed, 665 companies were able to provide full salaries to their staff (59.80%).
2. Company status
90% of respondents’ companies have resumed work in full or in part (including remote working), and less than 10% of companies have not resumed work at all.
Of the total sample, there were 2,792 respondents (47.85%) who have entirely resumed work (including working remotely). 2,468 respondents (42.30%) have partially resumed work (including remotely); and 575 respondents (9.85%) have not resumed work. This indicates that the vast majority of respondents (90.15%) have resumed work to some extent, but less than half (47.85%) are back to normal operations.
3. Pay cuts and layoffs
More than two-thirds of the companies have not reduced wages, and the vast majority (84%) have not laid off staff.
More than two-thirds of respondents’ companies have not cut salaries, accounting for nearly 4,000 of the sample. 1,014 worked for companies in which pay cuts were 20% or less, 552 worked for companies where pay cuts were 20-50%, and 273 worked for companies cutting more than 50%.
4,925 respondents said that their company did not lay off employees, 84.4% of the total sample. Another 770 respondents said that the company’s overall layoffs had been kept under 20%. 117 said their company laid off 20-50% of its workforce, and 23 respondents worked for companies laying off more than 50%.
The above statistical results regarding pay cuts and layoffs are highly consistent with the results of the entrepreneur’s survey and analysis in Survey #1, in which we found that of the 1,112 companies surveyed, more than half of the entrepreneurs chose not to reduce staff salaries even when they were waiting to start work. There were 665 companies keeping full salary (59.80%); more than half of entrepreneurs chose zero layoffs even if they had difficulties operating. There were 619 companies (55.67%) that chose not to lay off employees.
4. Operation resumption
More than half of survey respondents believe their companies will resume full operations by the end of March.
Of the 5,835 respondents, 3,227 (55.30%) reported that their companies would likely resume operations before the end of March. In Survey #1, 37.32% believed their companies would resume operations by the end of March. Only 169 respondents think that the company will resume operations in June and after, accounting for less than 3%.
At the same time, we further analyzed the correlation between seniority and the belief of when they would return to regular business hours and found significant trends.
In this survey, the proportion of top leaders and executives in the survey were 13.47% and 13.64% respectively, with a total number of 1,582; middle managers accounted for a relatively high number, 17.79%; the number of junior managers accounted for about 12.77%; the proportion of regular employees was 42.33% of the total.
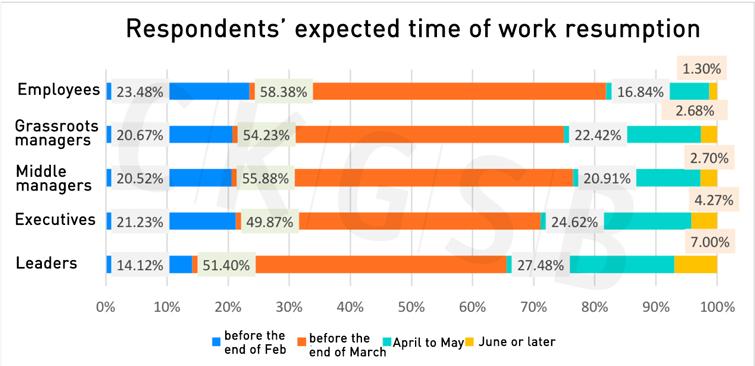
1) There is consistency across ranks for the most likely and least likely time to fully resume operations. Regardless of the company’s top managers, managers at all levels, or regular employees, it is expected that the company will have the highest proportion of full-scale resumption of operations before the end of March (almost all levels are more than half), and the lowest in June and after (all less than 10%) .
Our survey showed, the higher the seniority, the more conservative their judgment, that is, the later they expected for a full restoration of business. For the two outlying timeframes given (before the end of February, and April to May), regular employee views differed from those of managers: more managers agreed on the likelihood of resumed operations from April to May than regular employees, and the proportion of regular employees who believed resumed operations would take place before the end of February was higher than that of managers.
It is also worth noting that, after a comparative analysis of Survey #1, we found that:
– With the passing of time and the progress of epidemic prevention and control, the judgment of entrepreneurs / leadership has also become more optimistic: the proportion of respondents saying an April-May and June and beyond for operation resumption has fallen, and the proportion believing operations will have completely resumed by the end of March has increased from 37.32% (Survey #1) to 51.4% (Survey #2).
– The results of both surveys show that the percentage of top leaders who see a recovery before the end of March is the highest, followed by April-May.
5. Expectations regarding annual company performance Most interviewees believed their companies would experience varying degrees of business decline, and it would be difficult to meet annual performance targets set prior to 2020.
As for estimations regarding achievement of goals, 2,011 respondents (34.46%) believed their company could achieve 70-90% of its annual target; 1,888 respondents (32.36%) believed their company could achieve 90-100% of its target; and 990 respondents (16.97%) thought they could achieve 50-70%; 350 respondents (6.04%) thought they would achieve less than 50% of their original target.
It is worth noting that there are still 594 respondents who believe their company will exceed their performance targets this year. The three industries with the highest expectations regarding performance targets are the: financial industry (17.85%), real estate industry (15.82%), and the internet indsutry(14.48) %).
Personal work status and expectations
1. Time spent at the office
Among the 5,835 respondents, more than a third (2,255) went to the company more than 5 days per week. 1,263 respondents (21.65%) went 3-5 days per week. Combining the above two items, we found that more than half of respondents (60.3%) went to the company for more than three days per week. However, there are still 1,448 respondents (24.82%) who have not yet begun working from the office (remote working or not yet back at work) by the time of the survey.
2. Satisfaction with the company’s epidemic prevention measures and employee care plan
The vast majority of respondents were satisfied or very satisfied with the preventive measures and employee care plan adopted by their companies.
Those satisfied or very satisfied with their company’s epidemic prevention measures accounted for 88.5%, a total of 5,163 respondents, while 595 respondents (10.2%) felt it was average, and only 77 people were dissatisfied.
4,882 respondents (85%) were satisfied or very satisfied with the care plans implemented by their company. 847 respondents (14.54%) thought their company did fine, and only 106 respondents (1.82%) were dissatisfied or very dissatisfied.
3. Working hours and office efficiency
The majority of survey respondents were working fewer hours than before the outbreak, and nearly half were working less than 50% of the time. More than half of respondents said that efficiency when working from home had declined to varying degrees.
Considering the prevalence of telecommuting at home, we asked respondents to compare working hours at home with those in the office before the outbreak. Statistics show that nearly half of the people spent less time working from home than working in the office. Nearly 2,688 respondents (46.07%) chose this option. 1,401 respondents (24.01%) worked 50-80% of what they were used to before. A total of 949 respondents (16.26%) said they were working 80% – 100% of what they used to work, while 616 respondents (10.56%) worked 100%-150% of the original time. Some 181 respondents (3.1%) worked more than 1.5 times as much as before.
Nearly 40% of the respondents said that their efficiency at home had decreased somewhat, and 14.89% experienced a sharp decline in efficiency. Combining the above two items, we found that more than half of the people’s working efficiency had declined to varying degrees. At the same time, 36.68% found no difference in their efficiency at home compared with in the office; and less than 10% found it had improved.
4. Satisfaction with work status and communication between colleagues
Most of the respondents expressed high levels of job satisfaction. About 68% of them were satisfied with their work status, and about 75.5% were satisfied with communication among colleagues.
There were nearly 4,000 respondents (68%) who were satisfied or very satisfied with their work status, and nearly 1,500 respondents (25.35%) felt that it was average, and 379 respondents (6.5%) were not satisfied. It can be seen that more than half of the respondents thought their status in the office was good. This is an interesting comparison with the statistical results of office efficiency. It could be due to various factors, such as the need in an epidemic to pay more attention to the family, which means expectations diminish.
During the epidemic period, nearly 4,400 respondents (75.5%) expressed satisfaction with, or high satisfaction with, communication between colleagues. 1,242 respondents (21.3%) thought that it was average, and 218 respondents (3.74%) were unsatisfied.
5. Level of stress
More than 70% of respondents believed they were currently under moderate or below moderate stress. The main sources of stress were the epidemic (58.66%), finances (40.19%), and work intensity (26.74%).
6. Layoffs / Salaries and bonuses / Switching jobs
72.21% of respondents believed they would not be laid off, 63.34% of respondents thought that their annual salary would be flat or increase, and more than 70% of the respondents thought they would not be able to or absolutely would not want to change jobs after the epidemic.
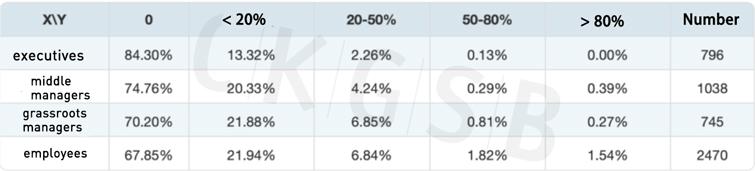
Through correlation analysis, we found that the belief in the possibility of being laid off had a strong negative correlation to seniority. The higher the seniority, the less likely the respondent felt they would to be laid off.
You think your chance of being laid off is:
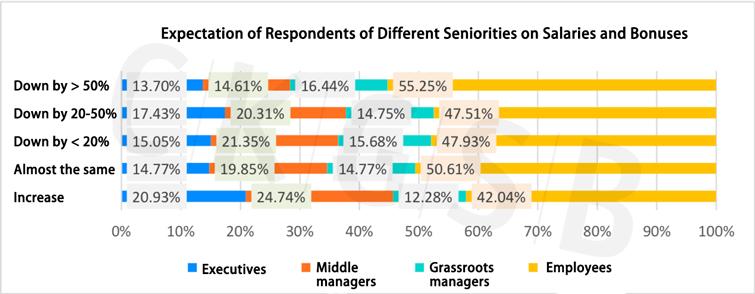
Among the 578 respondents who felt their annual salary or bonuses would increase, regular employees accounted for the highest proportion at 42.04%, junior managers accounted for the lowest proportion (12.28%), and middle and senior managers accounted for 24.74% and 20.93% respectively. Among the respondents who felt salaries and bonuses would drop by 50%, regular employees accounted for 55.25%, and the proportion of junior, middle-level, and senior-level managers decreased respectively, from 16.44% to 14.61% to 13.7%.
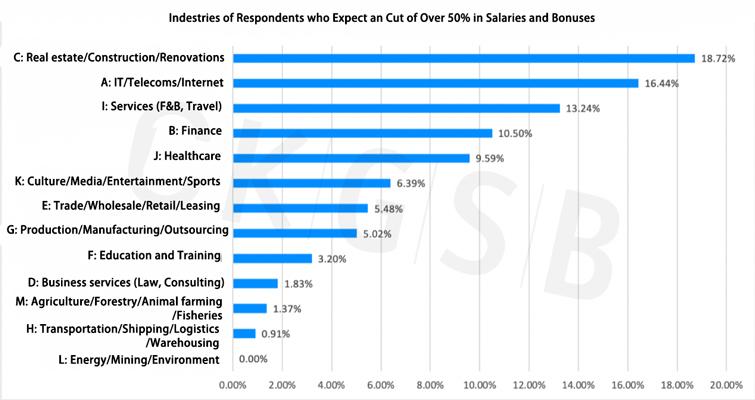
Among the 219 respondents who believed annual salary and bonuses would fall by more than 50%, the three industries at the top were real estate (18.72%), the internet (16.44%), and services (13.24%).
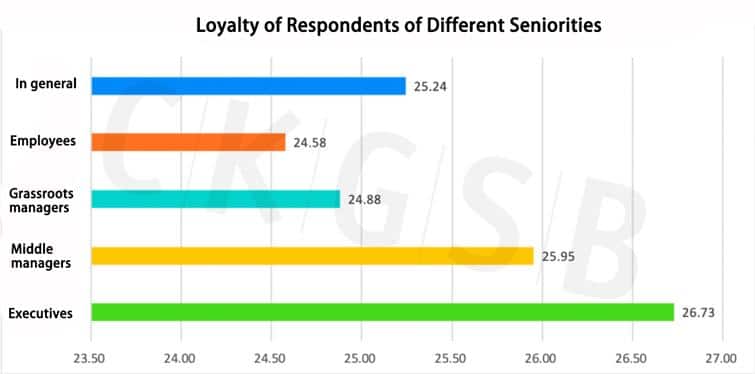
7. Loyalty status
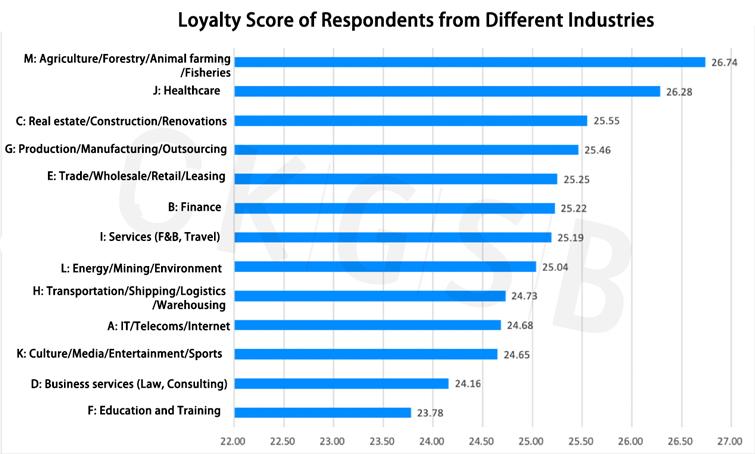
The loyalty score of the respondents (excluding top leaders) was 25.24 out of a total of 30 points. The loyalty of respondents correlated to their seniority, with the more senior the respondent, the more loyal they felt. The three industries with the highest loyalty scores were farming/forestry/fishing, medicine/health care and real estate/construction/interiors.
Summary
This second survey focuses on the impact the coronavirus epidemic has on the Chinese economy and how this impact the psychological resilience among employees. The sample has expanded from the original 1,112 leaders and executives to 5,835 full-time employees. Through analysis of the data, we found that despite the unprecedented challenges brought by the epidemic, surveyed entrepreneurs and employees have shown higher levels of resilience, more optimistic expectations, lower levels of stress, higher satisfaction, and higher loyalty than was perhaps expected.
From the perspective of entrepreneurs, the first survey found that during the survey period (February 12-13), more entrepreneurs chose to keep up their confidence in business prospects and seek ways to improve team cohesion. Most of them chose not to reduce wages or staff numbers, reorienting focus towards employee health and safety instead. The overall results of the second phase of the survey have lent support to the above findings. The macroeconomic factor that cannot be ignored, is that between the two surveys, the situation in China has improved, the number of newly diagnosed patients has continued to decline, and daily new diagnoses in provinces outside Hubei have fallen significantly.
From the perspective of employees, the results of the second survey show that employees are highly satisfied with their company’s protective measures and employee care package, and are optimistic about their company’s full operational recovery and solid annual performance. It appears to date that most people will not choose to change jobs, showing a high degree of loyalty.
Further analysis articles will be released focusing on the important topics such as gender and industry by highlighting resilience, stress, employee loyalty, remote office and other relevant variables, whilst also exploring the correlation between them.
The CKGSB Leadership and Incentive Research Center aims to study the development of enterprise leadership in different natures and fields. It conducts research on the establishment of talents development system, leadership cultivation, cutting-edge leadership, and successful incentive cases, in which it provides valuable reference for different types of enterprises. It focuses on making the research results into practical use in both of academic and commercial values.
Note: The above comprises the main findings of the Episode #1’Tracking Work Resumption’ in the ‘Psychological Resilience of Business Owners and Employees before and after Work Resumption due to COVID-19 #2’. The following 4 episodes will be released soon.
Enjoying what you’re reading?
Professor profile

ZHANG Xiaomeng
Associate Professor of Organizational Behavior, Associate Dean for EMBA Program, Associate Dean for Inclusivity, Diversity and Equity, Executive Academic Director for Executive Education and Director of the Research Center for Leadership, Behavioral Science & Inclusivity, Cheung Kong Graduate School of Business (CKGSB)
PhD, the R.H. Smith School of Business at University of Maryland, College Park


Related Articles


Our Programs
Global Unicorn Program: Scaling for Success in the Age of AI
In partnership with Stanford Engineering Center for Global & Online Education
Global Unicorn Program Series
This CKGSB program equips entrepreneurs, intrapreneurs and key stakeholders with the tools, insights, and skills necessary to lead a new generation of unicorn companies.
LocationStanford University Campus,
California, United States
Date29 Sep - 03 Oct, 2025
LanguageEnglish with Chinese Translation

Emerging Tech Management Week: Silicon Valley
In partnership with UC Berkeley College of Engineering
Global Unicorn Program Series
This program equips participants with proven strategies, cutting-edge research, and the best-in-class advice to fuel innovation, seize emerging tech developments, and catalyse transformation within your organization.
LocationUC Berkeley
Date02 - 07 Nov, 2025
LanguageEnglish

Asia Start: AI + Digital China Expedition
Asia Start provides entrepreneurs and executives with unparalleled access to Asia’s dynamic digital economy and its business ecosystems, offering the latest trends and insights, strategies, and connections to overcome challenges and unlock future growth for your business in Asia and beyond.
LocationShanghai, Hangzhou, Guangzhou, Shenzhen
Date17 - 21 Nov, 2025
LanguageEnglish

Smart Cities, Fintech, and Alternative Energy for the Global Future
In partnership with Columbia Engineering
Global Unicorn Program Series
This program is a transformative initiative designed to empower civil leaders and businesses in smart city development, fintech, alternative energy, and new energy sectors.
LocationDubai, UAE
Date15 - 19 Dec, 2025
LanguageEnglish

Opportunities in the Disruption of Traditional Industries
In partnership with The University of Sydney
Global Unicorn Program Series
The Global Unicorn Program in Disruption of Traditional Industries – presented jointly by CKGSB and University of Sydney – will emphasize Australia’s distinctive contributions.
LocationSydney, Australia
Date24 - 27 Feb, 2026
LanguageEnglish
AI-Driven Healthcare Innovation Program
In partnership with Johns Hopkins Carey Business School
Global Unicorn Program Series
The 2025 Artificial Intelligence (AI)-Driven Healthcare Innovation Program stands at the forefront of addressing the critical need for innovative healthcare solutions powered by artificial intelligence.
LocationJohns Hopkins University, Washington, D.C.
DateSummer 2026