


Psychological Resilience Before and After Work Resumption during COVID-19
Episode #2: Resuming work: Gender Differences
April 21, 2020
This survey was led by Dr. Zhang Xiaomeng, Associate Professor of Organizational Behavior, Associate Dean for Executive Education and Co-Director of the Leadership and Motivation Research Centre at the Cheung Kong Graduate School of Business (CKGSB)
The COVID-19 pandemic has forced us to press pause on the Chinese economy, with companies now facing challenges on the issues of production and employment resumption. Now more than ever, it is vital that we work together to recover from losses while remaining vigilant to ongoing risks. Individual psychological resilience has a strong bearing on corporate resilience and the time it takes for the Chinese economy to bounce back. Whilst it goes without saying that a strong rebound is essential, the issue now is how to resume production and employment whilst ensuring risk is kept at bay.
Following the first episode on the overall discovery of resilience during work resumption, this Episode #2 will focus on the topic of gender and explore the correlation between various variables such as resilience, stress, and loyalty, to name a few.
Overall conclusions
In the return to work period, women in general are facing greater challenges in terms of income, working hours, anxiety and depression, as well as lower levels of psychological resilience that men, but it is worth mentioning that: stress indices and psychological resilience levels of female business owners are generally higher than those of men of the same level.
1. The proportion of female leaders, middle managers, grassroots managers, and regular employees with a college degree is higher than that of men of the same level. The proportion of postgraduates and above in all ranks is higher for women than for men.
2. Women are strikingly underrepresented in management roles. From a female perspective, gender is negatively correlated to the level of responsibility and years of work. As level rises and working years increase, the proportion of women to men gradually decreases.
3. Female respondents mainly work in lower-revenue, small and medium-sized enterprises, outnumbering men in companies with a headcount of under 1,000 and with less than RMB 50 million in revenue.
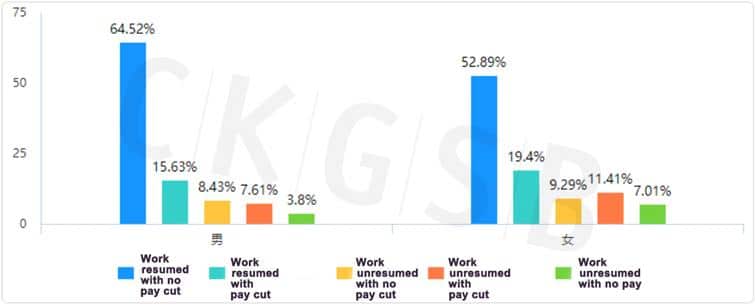
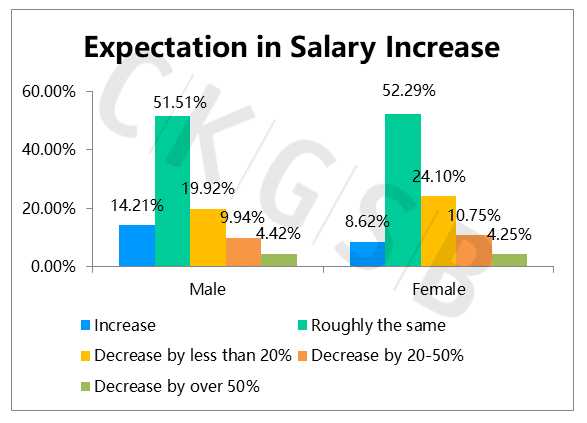
4. In returning to work, women face greater income pressure: the proportion of women returning to full pay (52.89%) is lower than that of men (64.52%), and the proportion of unpaid women waiting to restart work (7.01%) is higher than that of men (3.8%). Proportion of women with full salaries is generally lower (66.39%) than that of men (70.26%), and proportion of women with a pay cut in various percentages is generally higher than that of men. As for expected annual incomes, 14.21% of men are predicting an increase in wages, compared with 8.62% of women.
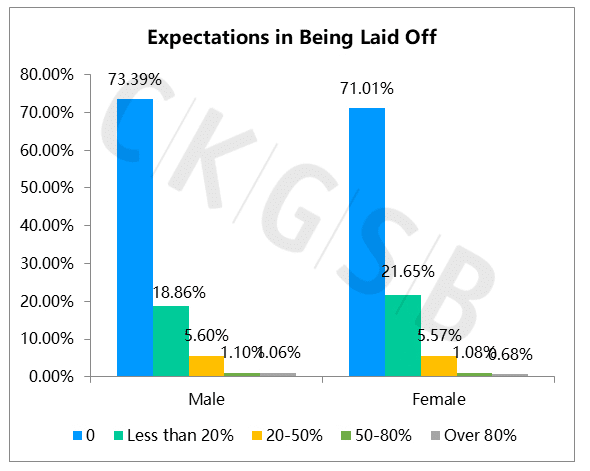
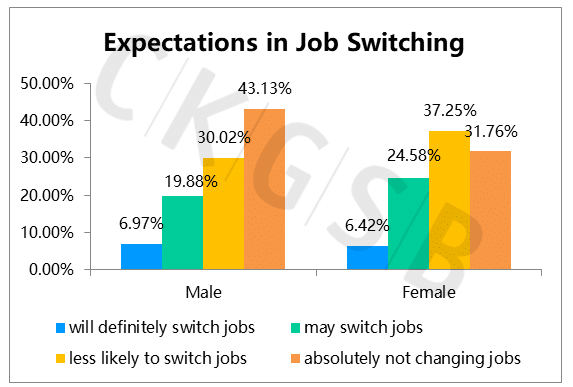
5. The overall loyalty score of men (25.51) is slightly higher than that of women (24.97). The proportion of “definitely will switch jobs” respondents is slightly higher among men (6.97%) than among women (6.42%). The proportion of male respondents who chose ‘definitely will not switch jobs’ (43.13%) is much higher than that of female respondents (31.76%). The proportion of women (71.06%) who believe they will not be laid off at all is lower than that of men (73.39%).
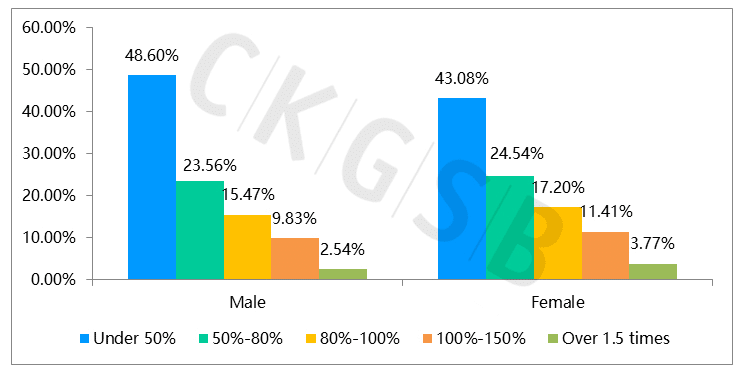
6. In comparing length of time between “working from home” and “working in the office”, the proportion of men who selected working from home for less than half of the time working in the office was higher among men (48.6%) than among women (43.08%). Women made up a higher proportion of those selecting working from home for more than 50% of the time when they work in the office, with those women selecting working at home more than one and a half times as much, making up 3.77% of the sample, higher than men at 2.54%.
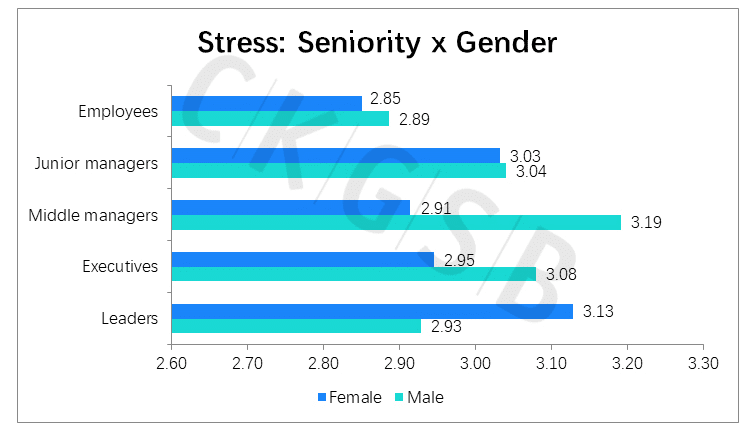
7. Women registered lower stress than men (2.91 as opposed to 3.0). For women leaders however, their stress level is higher than that of men in similar positions (3.13 as opposed to 2.93). The percentage of women leaders who have not resumed work (14.44%) is higher than that of men (9.02%). Women’s satisfaction with the way their workplace has communicated is higher than that of men, while their satisfaction with workplace status, employee care, and epidemic prevention measures is slightly lower than of men.
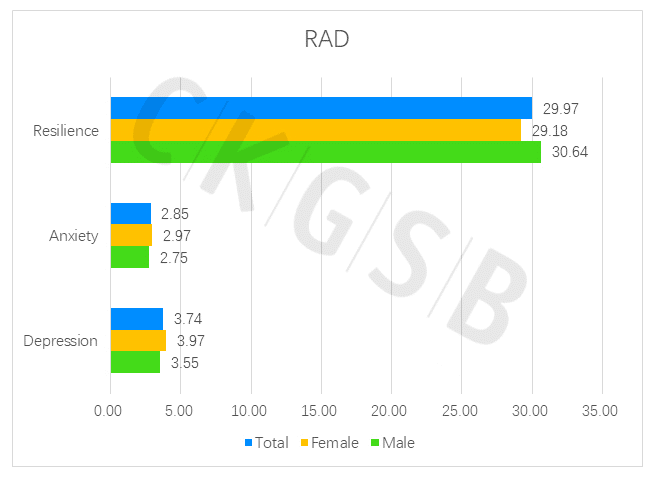
8. The average value of male psychological resilience (30.64) is higher than for women (29.18; maximum psychological resilience value of 40), and the average value of female anxiety (2.97) is slightly higher than that of men (2.75; maximum anxiety value of 21). The average level of depression (3.97) is slightly higher in women than in men (3.55; the maximum depression index is 27). Men and women as a whole showed higher levels of mental resilience, with anxiety and depression scores within normal ranges. Female leaders and executives are more resilient than their male peers.
Sample distribution from a gender perspective
1. Gender: Men comprise 54.05% of respondents and women 45.95%, making a gender ratio of 117.6 with women as 100, higher than the 2018 national population gender ratio of 104.64. (Source: National Bureau of Statistics)
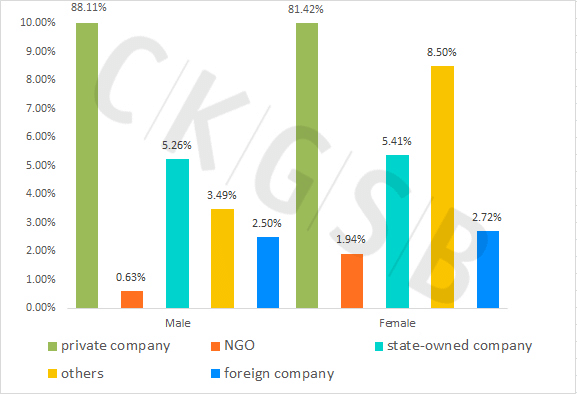
2. Company type: More than 85% of respondents are from private firms. Those from state-owned and other types comprise 5.33% and 5.79% respectively. Foreign companies and non-profit organizations account for a relatively low proportion: 2.6% and 1.23% respectively. From a gender perspective, the proportion of female respondents in foreign companies, non-profit organizations and other types of company is higher than that of men.
3. Seniority: Respondents can be categorized by level of leadership as follows:
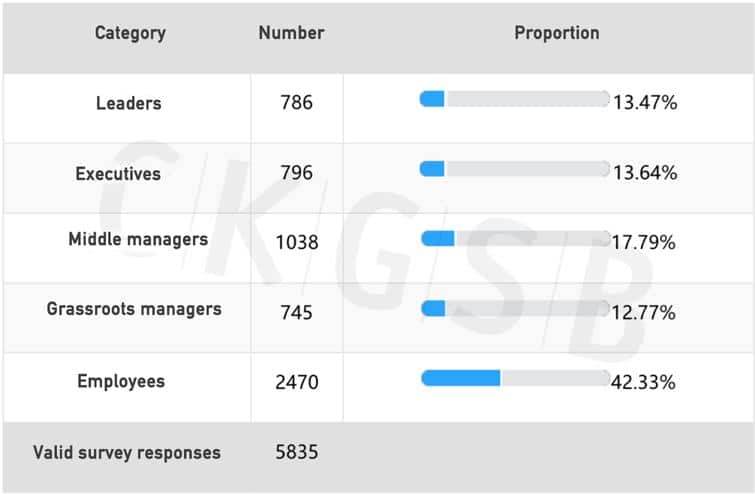
From the perspective of gender distribution at various leadership levels, women comprise the greater percentage of respondent’s ranks as employees, at 57.81%. As leadership level rises, the proportion of women gradually decreases. At director level, the gender ratio of women to men is lowest at 23.79% to 76.21%. 786 of respondents were at leader level, of which 599 were men and 187 women.
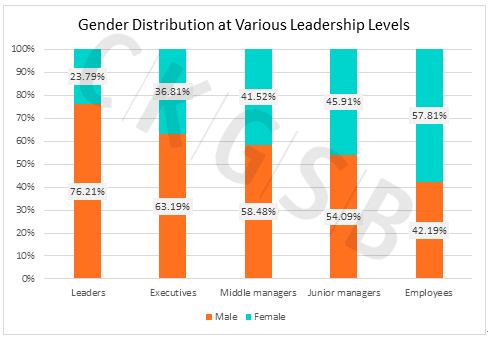
From a women’s perspective, gender and rank have a negative correlation. The Spearman correlation coefficient is -0.23 **, and the p value is 0.00, which means the higher the rank, the lower the proportion of women.
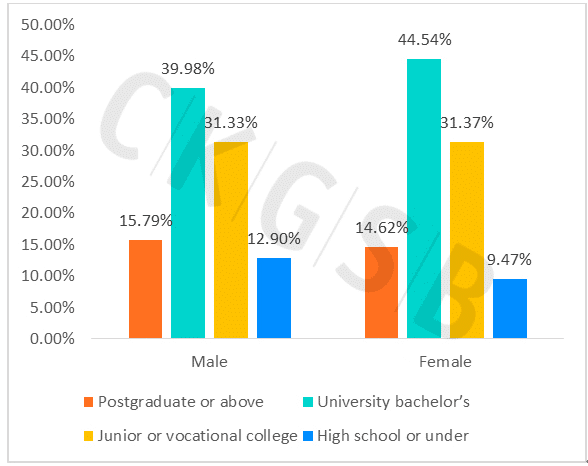
4. Education: In gender terms, more male than female respondents completed technical secondary college to junior college or a bachelor’s degree. Respondents with high school or lower or post-graduate and above education are proportionally more male than female. Overall, the proportion of respondents with bachelor’s degree or above (including undergraduate and postgraduate) is somewhat higher for women (59.16%) than for men (55.77%).
Overlaying gender and leadership rank to analyze educational distribution, we found that:
Apart from female executives, female leaders, middle managers, grassroots managers, and regular employees with a college degree make up a higher proportion than men at the same level. Female senior executives comprise a slightly lower percentage of undergraduates than men.
The proportion of postgraduates and above of women in all ranks is higher than that of their male peers.
![]()
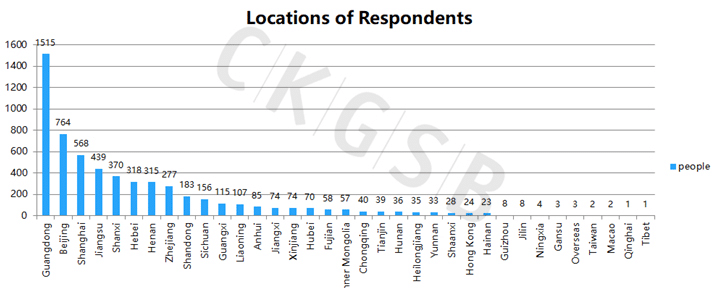
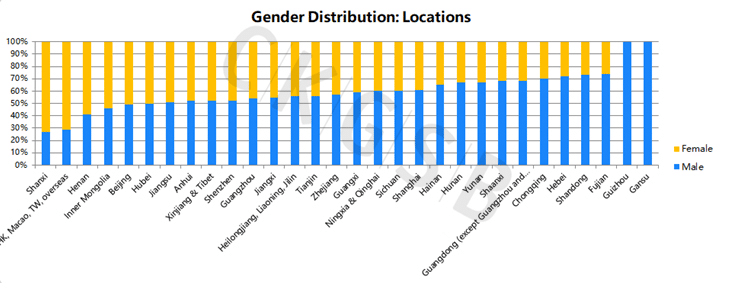
5. Geography: Most female respondents worked in Shanxi, Hong Kong, Macao, Taiwan and Overseas, and Henan Province.
6. Number of employees: In the sample as a whole, respondents from small and medium enterprises accounted for a relatively high proportion: 60.3% of respondents were from companies with fewer than 500 employees.
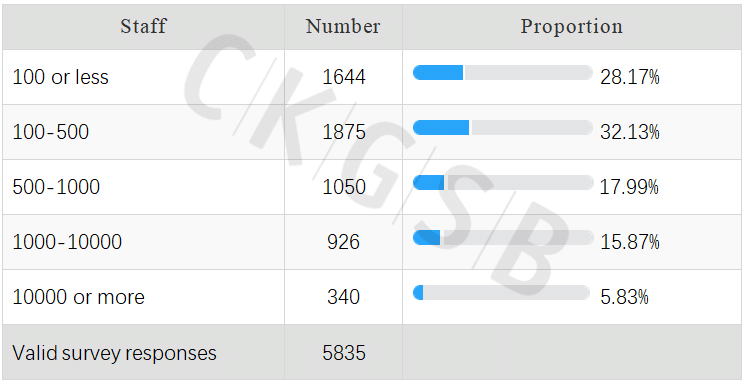
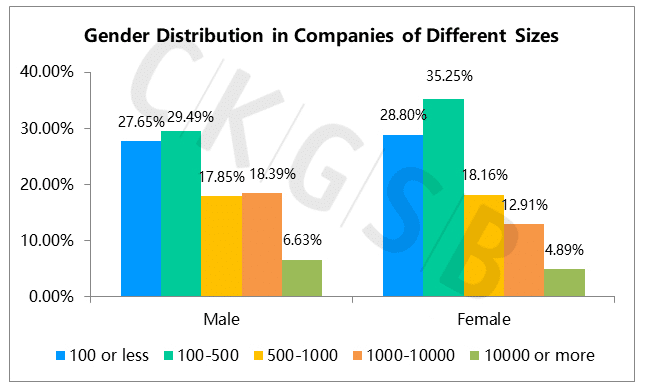
More women respondents than male respondents worked in companies with 100, 100-500 people, and 500-1000 people, whereas more men than women respondents worked for large companies with 1,000-10,000 and more than 10,000 employees.
7. Company revenue: 19.5% of respondents represented companies with revenue of between RMB 100 million and 500 million. 18.11% of respondents represented companies with revenue of over RMB 1 billion.
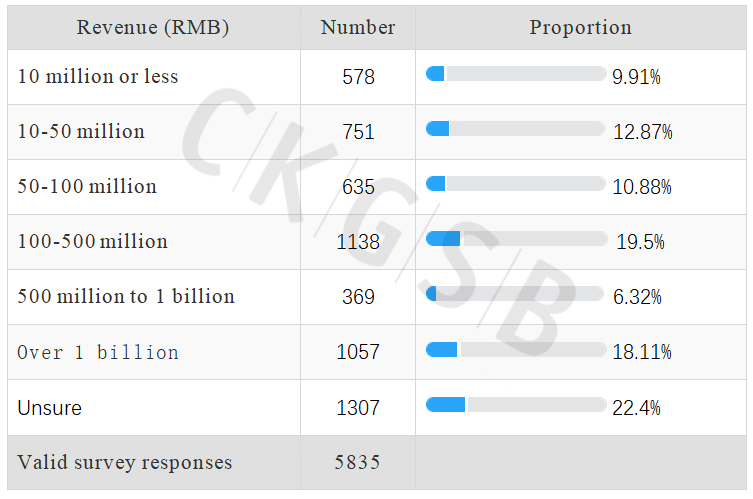
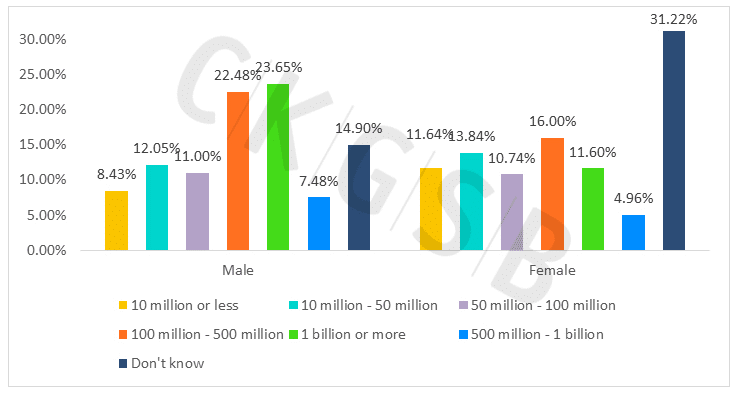
More female respondents than male respondents work in companies with revenues of less than RMB 10 million and in companies earning RMB 10-50 million. More men than women work in the four tiers of companies with revenues over RMB 50 million. 23.65% of male respondents work for companies with revenue of more than RMB 1 billion, far higher than the 11.6% of women.
It is worth noting that more than 20% of the respondents (1307 people) are not aware of the annual revenue of the company they work for. Among female respondents, 31.22% were unclear about their company’s revenue, which is a much higher percentage than for men (14.9%). This may be due to the low representation of women in management (see Conclusion 2. Gender and rank negative correlation above). In addition, 76.82% (1004) of respondents who did not know their company’s revenue were regular employees, 14.61% (191) grassroots managers and 6.12% (80) middle managers. This result should attract the attention of senior management. When employees do not understand the basic situation and the company’s development direction, their loyalty and company efficiency, as well as their own psychological resilience and anxiety at work should be called into question.
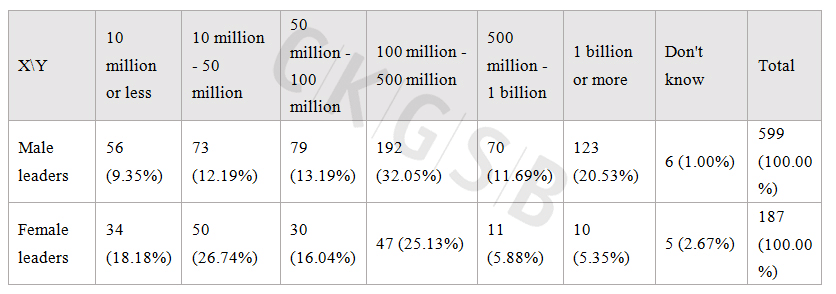
From the perspective of revenue, we compared the ratio of male leaders to female leaders. Male leaders (34.73%) account for far less than female leaders (60.96%) in companies with revenues below RMB 10 million, RMB 10-50 million, and RMB 50 million to RMB 100 million, while the number of male leaders (64.27%) is far higher than that of women (36.36%) in companies with revenues of RMB 100 million to RMB 500 million, RMB 500 million to RMB 1 billion, and more than RMB 1 billion. Among them, the most significant difference is that for companies with more than RMB 1 billion companies in revenue, the number of male leaders (20.53%) is much higher than that of women (5.35%), and the other significant difference is that in companies with revenue of RMB 10 million to RMB 50 million, the number of female leaders (26.74%) is much higher than that of male leaders (12.19%).
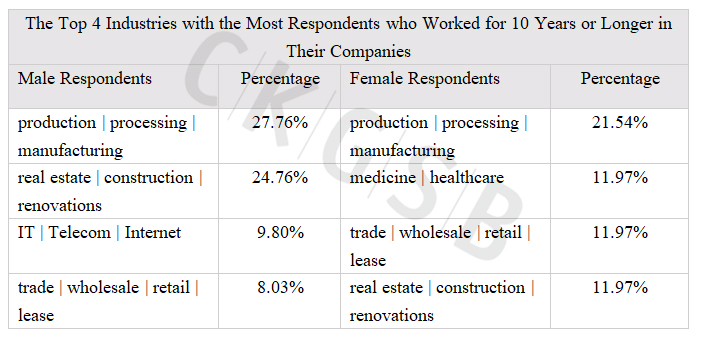
8. Years at the company: more men than women have worked for 5-10 years, or more than 10 years at the current company; more women than men have worked for more than 1 year, 1-3 years, or 3-5 years.
The sample data shows that from the perspective of women, gender and working years have a negative correlation. The Spearman correlation coefficient is -0.13**, and the p value is 0.00, which means as working years increase, fewer women work at the companies.
9. Industry: The industries with the highest proportion of respondents are real estate, the internet, production/processing/manufacturing, finance, medicine /healthcare, and the service sector.
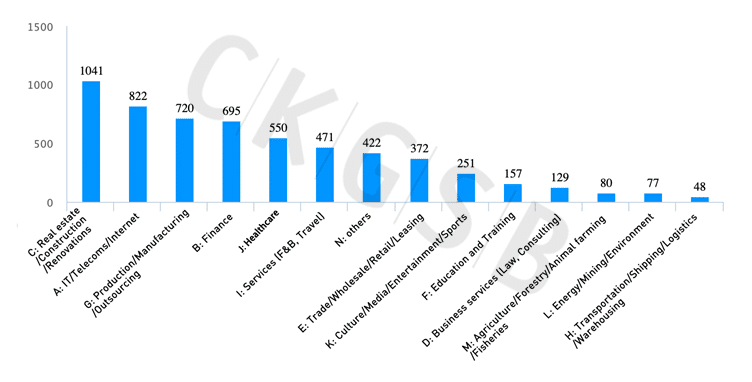
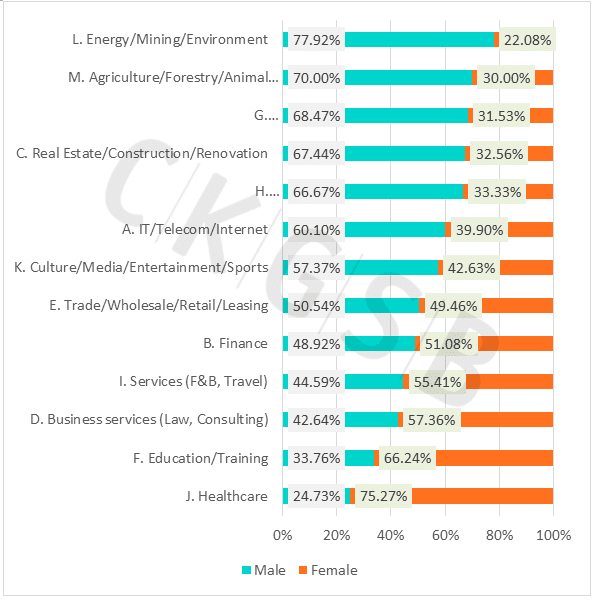
Gender ratio by industry: highest proportion of women: healthcare (75.27%); lowest: energy/minerals/environmental protection (22.08%), the most balanced gender ratio of men and women is in trade/wholesale/retail (50.54%:49.46%).
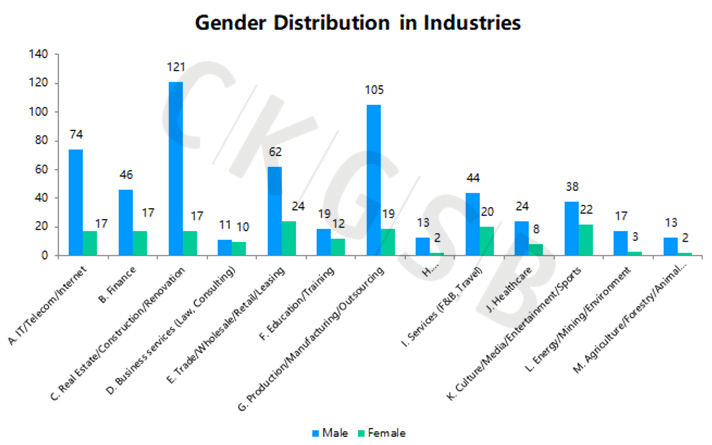
Our sample comprises 786 top leaders, of whom 599 are men and 187 women. The three industries with the highest number of male leaders are: real estate (121), production | processing | manufacturing (105), and internet (74). The three industries with the largest number of female leaders are: trade | wholesale | retail | lease (24), culture | media | entertainment | sports (22) and services (20).
Gender differences regarding the return to work
1. Salary status: The percentage of men returning to full pay (64.52%) is higher than that of women (52.89%), and the proportion of unpaid women (7.01%) who are waiting for work is greater than men (3.8%).
In analysis of ‘gender and rank,’ female regular employees (46.92%) have the lowest percentage of full-pay reinstatement, and male leaders (71.97%) have the highest percentage; male leaders (14.69%) have the highest percentage of full-pay among those who are yet to resume work and male middle managers (6.1%), the lowest percentage. the highest proportion of no pay while waiting to get back to work is female regular employees (9.1%).
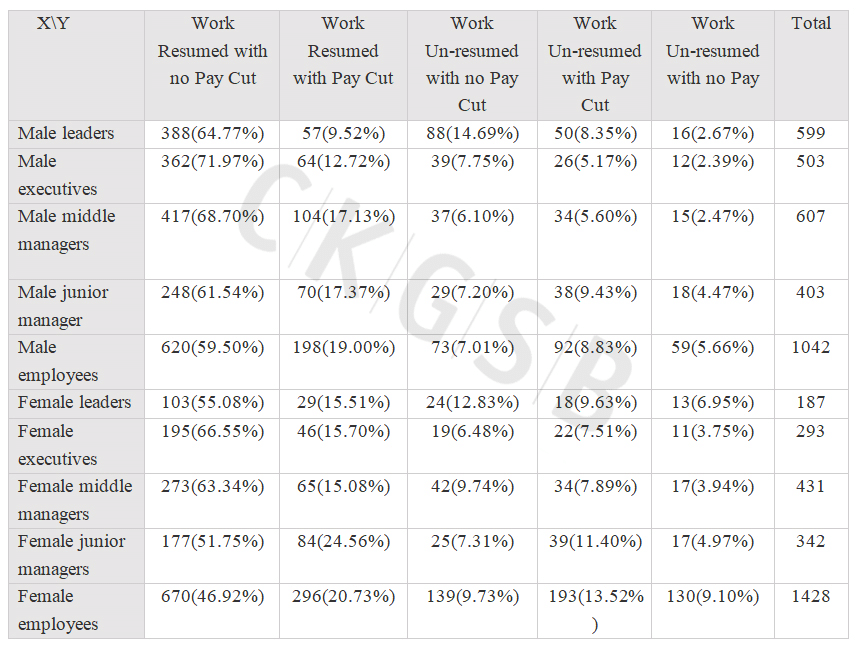
The sample data shows that from the perspective of women, gender and ‘pay cut and return to work status’ are negatively correlated. The Spearman correlation coefficient is -0.12 ** and the p-value is 0.00, which means that as the options change from ‘full return to work with no pay cut’ to ‘no pay and not back to work’, the proportion of women is increasing.
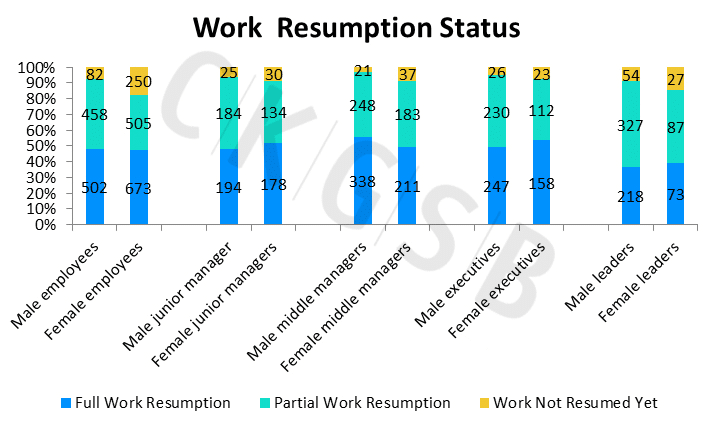
2. Status of resumption of work in enterprises: If we consider each company’s leader to represent one company, proportion of companies led by female leaders that haven’t resumed work is higher than that of companies led by male leaders that haven’t resumed work (9.02%). The highest percentage of non-return is that of female regular employees.
3. Expectations for the full recovery of the business: Female leaders (45.99%) and female senior executives (49.49%) have a lower percentage of judges on the restoration of business before the end of March than male leaders (53.09%) and male senior executives (50.10%). The proportion of women leaders and executives who believe they will resume business in April-May, June and beyond is higher than that of men at the same level.
From the perspective of ‘gender and industry,’ the highest proportion of expected work resumption before the end of March was women in the healthcare industry (73.91%), the highest proportion of expected work resumption between April and May was men in education | training industry (52.83%), and the highest proportion of operations resumption in June and after was women in the culture | media | entertainment | sports industries (9.35%).
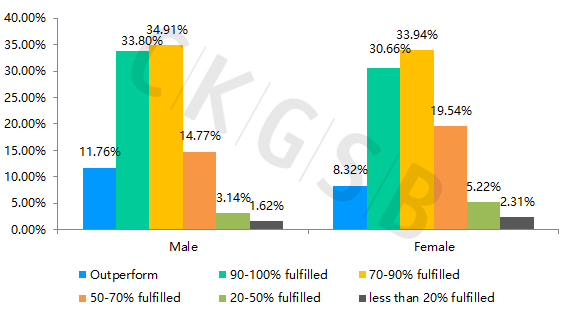
4. Expectations for the company’s full-year performance: more male than female believe that their company will outperform pre-outbreak performance expectations, 90-100%, or 70-90% as well as expected prior to the outbreak; more women than men believe their company will fulfill only 50-70%, 20-50% or below 20% of the performance goals set before the outbreak for 2020.
From the perspective of ‘gender and rank,’ with the exception of female middle managers, less female respondents than their male counterparts expected their companies to reach 90%-100% of their performance target or to over-perform. Less female respondents than male respondents thought their companies’ expected performance will be below 20% of the target. More women respondents, at all levels, than men, expected their companies to achieve 20%-50% of their performance goals. We have not seen a consistency related with ranks in other options.
Gender differences in personal work status
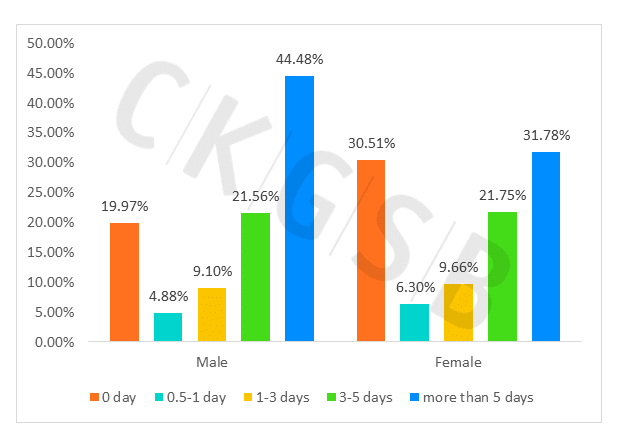
1. As for the time that people work in the office: more women (30.51%) than men (19.97%) do not go to the office to work; and the proportion of men who work in the office for 5 days or more a week ( 44.48%) is much higher than women (31.78%).
Grouped by ‘gender and rank,’ male executives (49.50%) account for the highest percentage of working in the office for more than 5 days a week, and female leaders (30.48%) account for the lowest percentage.
The highest percentage of respondents not working from the office (day 0) were female regular employees (35.92%), and the lowest were male middle managers (14.50%). Grouped by ‘gender and industry,’ the highest proportion of respondents who work from the office for 5 days or more a week (61.66%) were men in the production | processing | manufacturing industries, while the lowest were women (10.39%) in the healthcare industry.
Most respondents who didn’t work from the office at all (0 days) were women in healthcare (69.08%), and the lowest proportion were women in energy | minerals | environmental protection | industries (5.88%).
2. On the comparison between working hours at home and in the office: Among the proportion of choosing to work from home less than half the time (under 50%) of working in the office, men (48.6%) made up a higher proportion than women (43.08%). For all who worked from home over 50% of the hours working in the office, women made up a higher percentage than men. More women (3.77%) than men (2.54%) work at home for more than 1.5 times as much working time in the office.
Grouped by ‘gender and rank,’ the highest proportion of “working from home less than half the time,” is that of male leaders (52.59%) whereas the lowest were women middle managers (37.82%). The percentage of selecting working 1.5 times more was highest among female middle managers (5.10%), and the lowest among male grassroots managers (1.49%).
Group by ‘gender and industry,’ for the option of “home office is less than 50% of work time”, the highest proportion is men in production | processing | manufacturing (59.23%), and the lowest proportion is women in business service (22.97 %). As for the option of “home office is 1.5 times or more than work time”, the highest proportion is that of women in agriculture | forestry | pastoral | fishing (8.33%), and the lowest is that of women in transportation | transportation | logistics | warehousing (0%).
3. Salary reduction and layoffs: Percentage of women with no pay cut (66.39%) is lower than men (70.26%), and the proportions of various salary reductions for women are higher than for men.
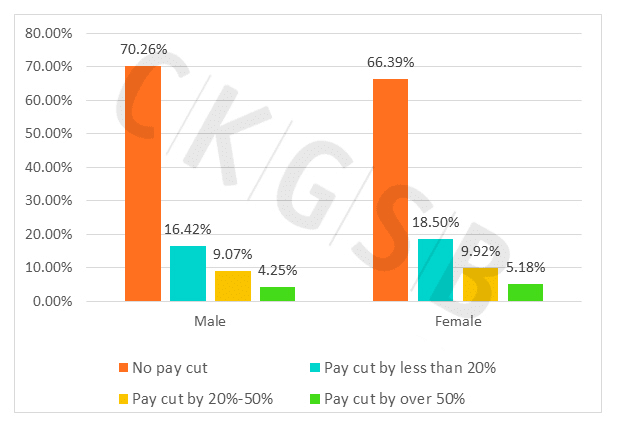
Grouped by ‘gender and rank,’ the highest percentage of full salary is male leaders (73.79%), the lowest is female grassroots managers (64.64%); the highest percentage of salary reductions of more than 50% is female grassroots managers (6.43%), followed by male executives (5.57%).
Except for leaders (as they didn’t need to answer questions whether they think they will be laid off and have pay cuts), the proportion of women who think they will not be laid off at all (71.06%) is lower than that of men (73.39%), and more women than men think there is a 20-50% possibility to be laid off. There is not much difference between men and women in the remaining three items.
The sample data shows that from the perspective of women, gender and layoff expectations have a positive correlation. The Spearman correlation coefficient is 0.14 ** and the p value is 0.00, which means that as the possibility of layoffs increases, the proportion of women is increasing.
Grouped by ‘gender and rank’ (except the leaders), 84.29% of male executives don’t think they will be laid off at all, which is the highest percentage among all groups and the lowest percentage is that of female regular employees (67.09%). Of groups that believe there will be 50-80% or over 80% for them to be laid off, male regular employees and female regular employees top the list.
4. Expectation in salary increase: 14.21% of male respondents think their salaries will increase, while 8.62% female respondents expect a pay increase. Slightly more women than men believe their salaries will be roughly the same as in last year. More women than men believe their salaries will decrease by less than 20% or by 20%-50%. More men than women believe they will have a pay cut of over 50%.
The sample data shows that from the female perspective, gender and expectation in salary decrease are expected to positively correlated. The Spearman correlation coefficient is 0.16 **, and the p value is 0.00, which means that as the expected decrease in salaries increases, the proportion of women is increasing.
5. Loyalty: Statistics on the probability of job change, the proportion of “will definitely switch jobs” is slightly higher for men (6.97%) than for women (6.42%), and in options “maybe” and “less likely” the proportion of women is higher than men, and the option of “absolutely not changing jobs” sees more men (43.13%) than women (31.76%).
From the perspective of ‘gender and rank,’ most selecting “absolutely no switching jobs” are male executives (57.06%), and the least are female regular employees (27.73%); the “most definitely will switch” option sees the largest proportion of male employees (9.6%) and the lowest proportion of female senior managers (3.75%).
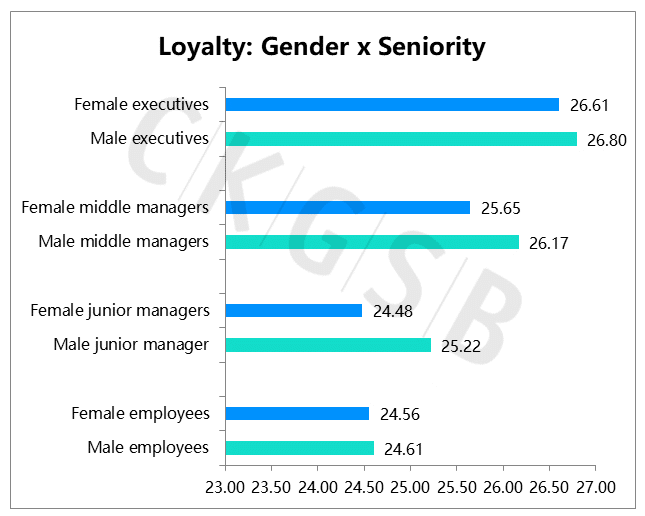
From the perspective of loyalty, the overall loyalty score was slightly higher for men (25.51) than for women (24.97), with the highest loyalty index being 30. (The higher the score, the higher the loyalty.) In terms of ‘gender and rank,’ men in all ranks scored slightly higher than women on loyalty. Male senior managers is the group with the highest average loyalty score (26.80) and female grassroots managers have the lowest loyalty score (24.48).
Gender differences regarding personal mental state
1. Job satisfaction
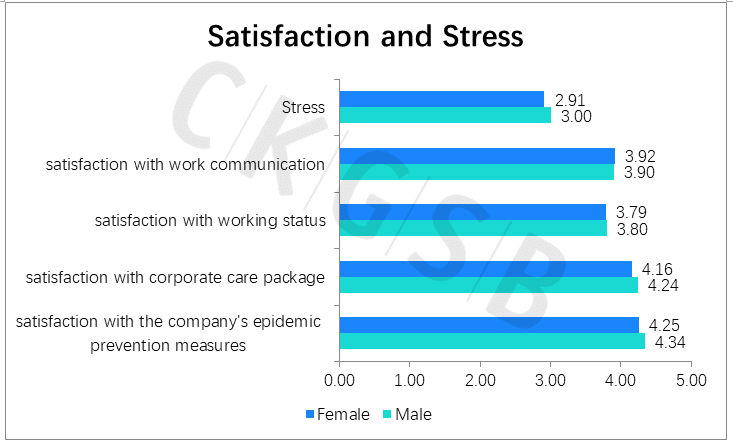
We have indexed the questionnaires related to satisfaction and stress, and the gender comparison is shown in the following graph:
On the whole, the average values of the stress and satisfaction index for men and women are not much different. The stress index for women (2.91) is lower than that for men (3.00). Women respondents’ satisfaction with work communication is higher than that of men. The satisfaction of women on their working status, corporate care package and epidemic prevention measures is slightly lower than that of men.
From the ‘gender and rank’ perspective, the proportion of ‘very satisfied with their work’ is the highest for male regular employees (27.45%) and lowest for male leaders (11.52%). Among respondents who chose ‘dissatisfied’, the largest proportion is male leaders (11.52%) and among respondents who chose ‘very dissatisfied’, the largest proportion is female leaders (3.21%), which partially reflects the current pressure of business leaders in responding to the epidemic.
In terms of communication satisfaction, male regular employees (33.30%) had the highest percentage of “very satisfied”, and male leaders (9.02%) had the lowest percentage; female leaders (8.56%) had the highest percentage of being “dissatisfied”, with the lowest being male regular employees (1.25%); the overall percentage of “very dissatisfied” is very low.
2. Stress levels
As mentioned above, the overall stress index of women is lower than that of men; in terms of sub-items, more men than women opted for the “very small”, “higher stress”, and “very high” options.
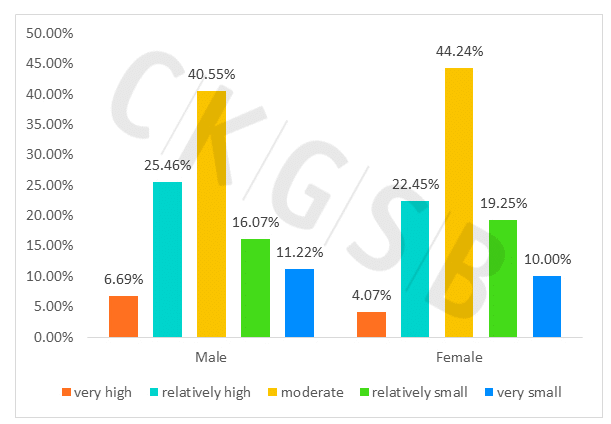
From the perspective of ‘gender and rank,’ male middle managers’ stress index is the highest (3.19), indicating that as a “sandwich layer”, they are under greater pressure in the company. Among female respondents, female leaders have the highest stress index (3.13); respondents with the lowest stress index are female regular employees (2.85) and male regular employees (2.89). Besides leaders, female respondents at all levels have lower stress levels than their male peers.
3. Sources of stress: The three main sources of stress among respondents were the outbreak, finance and work intensity. Fewer women chose outbreak and finance than men, and more women chose work intensity (28.09%) as their source of stress than men (25.59%).
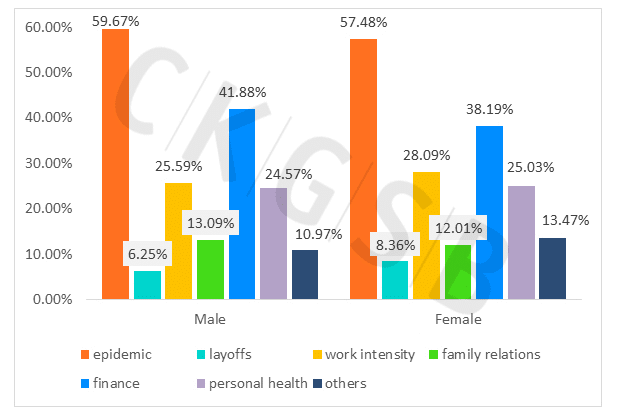
From the perspective of ‘gender and rank,’ male leaders (68.78%) and female leaders (66.84%) selected the epidemic outbreak as the main source of stress, and among respondents selecting the finance the largest proportion is the male grassroots managers (48.64%), and the highest percentage choosing the work intensity is male middle managers (37.89%).
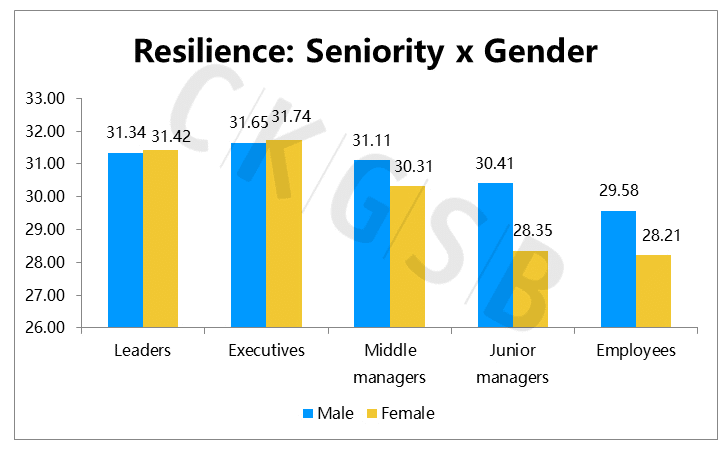
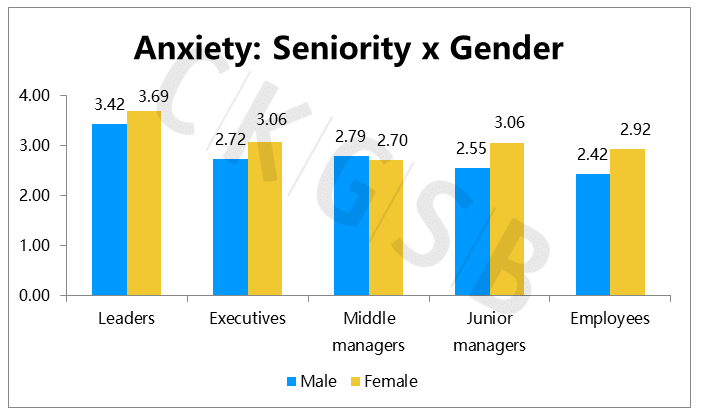
4. Resilience: Overall, the average mental resilience of men (30.64) is higher than that of women (29.18; the maximum value of psychological resilience index is 40), and the average value of anxiety of women (2.97) is slightly higher than that of men (2.75; the maximum value of anxiety index is 21), and women’s average depression degree (3.97) is slightly higher than that of men (3.55; the maximum depression index is 27). Men and women as a whole showed relatively high levels of psychological resilience, with anxiety and depression scores within normal ranges.
From the perspective of ‘gender and rank,’ the psychological resilience of female leaders and executives is higher than that of their male peers. Male middle managers, grassroots managers and regular employees have more psychological resilience than women at the same level. Among them, the rank with the largest difference in the average scores of the psychological resilience of the genders is the managers at the grassroots level, with men (30.41) higher than women (28.35) by 2.06 points.
Except for middle managers, the average score of anxiety of women in all ranks is higher than that of men. The female leaders have the highest anxiety score (3.69) and male regular employees have the lowest scores (2.42).
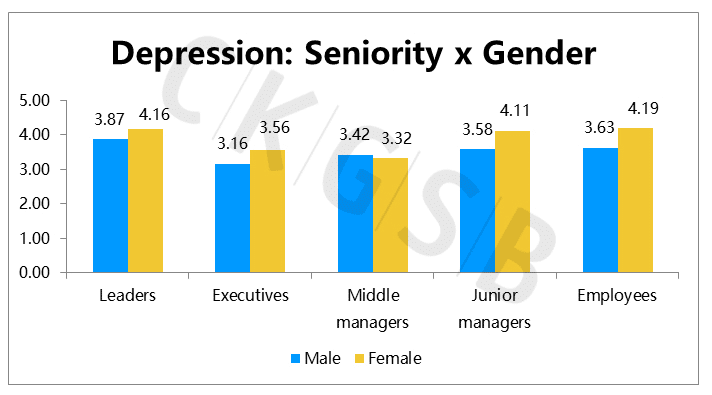
Except for middle managers, the average depression score of women in all ranks is higher than that of men. The highest score for depression was that of female regular employees (4.19), and the lowest score was for male executives (3.16).
Summary
The above is an analysis of the survey data from the perspective of gender. We see that before and after the resumption of work, the interviewed entrepreneurs and employees showed high resilience, optimistic expectations, low to medium stress levels, high satisfaction, high levels of loyalty, but gender differences are prominent. Compared with male respondents, female respondents suffered greater income reduction risks before and after returning to work, higher work intensity, higher levels of anxiety and depression, and lower levels of psychological resilience. Therefore, for female employees, companies should give more care and trust, and allow for more flexible office methods to improve their loyalty to the company.
At the same time, the study found that female leaders and executives show higher levels of psychological resilience than men of the same level under the premise of greater pressure, which is critical to improving the resilience of the entire organization. Therefore, companies should give female employees a smoother promotion path, more empowerment and growth opportunities in the selection and retention. At the same time, they should stimulate women to show more leadership, and promote the advantages of a more balanced leadership for the benefit of the companies’ development after the epidemic.
Please stay tuned for our Episode #3 on organizational resilience.
Enjoying what you’re reading?
CKGSB Report


Related Articles

Our Programs

Global Unicorn Program: Scaling for Success in the Age of AI
In partnership with Stanford Engineering Center for Global & Online Education
Global Unicorn Program Series
This CKGSB program equips entrepreneurs, intrapreneurs and key stakeholders with the tools, insights, and skills necessary to lead a new generation of unicorn companies.
LocationStanford University Campus,
California, United States
Date29 Sep - 03 Oct, 2025
LanguageEnglish with Chinese Translation

Emerging Tech Management Week: Silicon Valley
In partnership with UC Berkeley College of Engineering
Global Unicorn Program Series
This program equips participants with proven strategies, cutting-edge research, and the best-in-class advice to fuel innovation, seize emerging tech developments, and catalyse transformation within your organization.
LocationUC Berkeley
Date02 - 07 Nov, 2025
LanguageEnglish

Asia Start: AI + Digital China Expedition
Asia Start provides entrepreneurs and executives with unparalleled access to Asia’s dynamic digital economy and its business ecosystems, offering the latest trends and insights, strategies, and connections to overcome challenges and unlock future growth for your business in Asia and beyond.
LocationShanghai, Hangzhou, Guangzhou, Shenzhen
Date17 - 21 Nov, 2025
LanguageEnglish

Smart Cities, Fintech, and Alternative Energy for the Global Future
In partnership with Columbia Engineering
Global Unicorn Program Series
This program is a transformative initiative designed to empower civil leaders and businesses in smart city development, fintech, alternative energy, and new energy sectors.
LocationDubai, UAE
Date15 - 19 Dec, 2025
LanguageEnglish

Opportunities in the Disruption of Traditional Industries
In partnership with The University of Sydney
Global Unicorn Program Series
The Global Unicorn Program in Disruption of Traditional Industries – presented jointly by CKGSB and University of Sydney – will emphasize Australia’s distinctive contributions.
LocationSydney, Australia
Date24 - 27 Feb, 2026
LanguageEnglish

AI-Driven Healthcare Innovation Program
In partnership with Johns Hopkins Carey Business School
Global Unicorn Program Series
The 2025 Artificial Intelligence (AI)-Driven Healthcare Innovation Program stands at the forefront of addressing the critical need for innovative healthcare solutions powered by artificial intelligence.
LocationJohns Hopkins University, Washington, D.C.
DateSummer 2026