

A look at Chinese outbound tourism statistics: which countries feature big on the travel plans of Chinese tourists and how they are impacting the local economy there.
The number of Chinese tourists criss-crossing the globe is swelling. As disposable incomes rise and the government eases restrictions on travel, more and more Chinese citizens are finding it easier to travel abroad. According to The Economist, “Nearly one in ten international tourists worldwide is now Chinese, with 97.3m outward-bound journeys from the country last year, of which around half were for leisure.”
They are also among the biggest spenders. According to the United Nations World Tourism Organization (UNWTO), in 2012 alone Chinese tourists spent a record $102 billion on international tourism. Back in 2000, only 10 million Chinese travelled abroad. In 2012 that figure stood at 83 million in 2012, making China the world’s fastest-growing tourism market.
This May Euromonitor forecasted 16% growth in China’s outbound market for 2014 after seeing expenditure reach a record level of $120 billion in 2013. CKGSB Knowledge shows where the travelers are going and what they’re encountering then they land. Click on the image for the details.

Hong Kong
Visitors: 34,914,505 (2012) 40,745,227 (2013)
Growth: 16.7%
Developments: Chinese visitors to Hong Kong hit a milestone in the summer of 2013, reaching a total of 4 million border crossing in a single month!
Macau
Visitors: 17,188,383 (2012) 18,632,207 (2013)
Growth: 8.40%
Developments: Mainland Chinese visitors’ market share of total number of visitors to Macau reached 65% in August, hitting a new record.
Thailand
Visitors: 4,000,997 (2012) 4,705,173 (2013)
Growth: 17.6%
Developments: A February 2014 poll from Chiang Mai University found that 80% of Chiang Mai residents were not happy with the massive influx of Chinese tourists thanks to the popularity of Lost in Thailand.
Taiwan
Visitors: 2,586,327 (2012) 2,874,702 (2013)
Growth: 11.15%
Developments: Mainland visitor numbers to Taiwan are slowly bouncing back from changes to restrictions on tour groups in early 2013, which caused a momentary lapse in volume.
Singapore
Visitors: 2,003,918 (2012) 2,269,853 (2013)
Growth: 11.60%
Developments: Even while Chinese visitor numbers dropped thanks to more stringent group tour restrictions, Chinese are still the top-spending tourist demographic in Singapore, shelling out $2.98 billion.
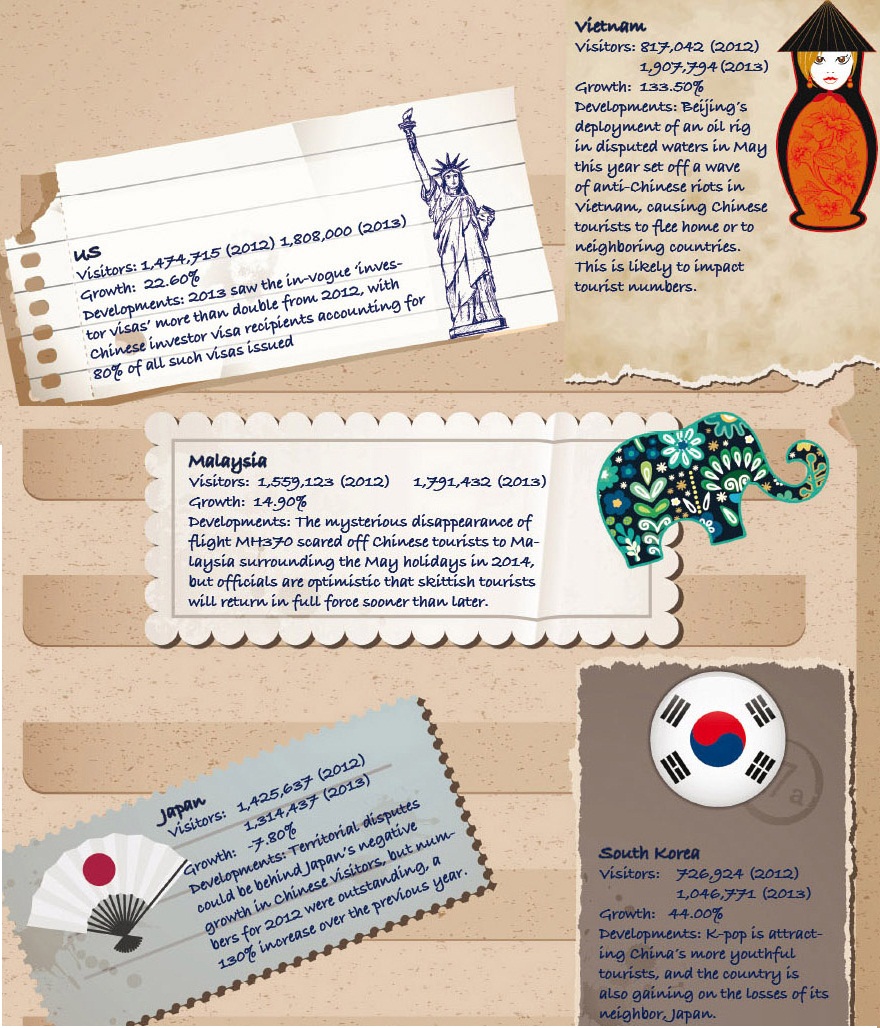
Vietnam
Visitors: 817,042 (2012) 1,907,794 (2013)
Growth: 133.50%
Developments: Beijing’s deployment of an oil rig in disputed waters in May this year set off a wave of anti-Chinese riots in Vietnam, causing Chinese tourists to flee home or to neighboring countries. This is likely to impact tourist numbers.
US
Visitors: 1,474,715 (2012) 1,808,000 (2013)
Growth: 22.60%
Developments: 2013 saw the in-vogue ‘investor visas’ more than double from 2012, with Chinese investor visa recipients accounting for 80% of all such visas issued.
Malaysia
Visitors: 1,559,123 (2012) 1,791,432 (2013)
Growth: 14.90%
Developments: The mysterious disappearance of flight MH370 scared off Chinese tourists to Malaysia surrounding the May holidays in 2014, but officials are optimistic that skittish tourists will return in full force sooner than later.
Japan
Visitors: 1,425,637 (2012) 1,314,437 (2013)
Growth: -7.80%
Developments: Territorial disputes could be behind Japan’s negative growth in Chinese visitors, but numbers for 2012 were outstanding, a 130% increase over the previous year.
South Korea
Visitors: 726,924 (2012) 1,046,771 (2013)
Growth: 44.00%
Developments: K-pop is attracting China’s more youthful tourists, and the country is also gaining on the losses of its neighbor, Japan.
Enjoying what you’re reading?
CKGSB Report


Related Articles

Our Programs

Emerging Markets: Innovation and Scaling for Exponential Growth
Global Unicorn Program Series
A joint program by Cheung Kong Graduate School of Business and The South Africa Chamber of Commerce and Industry
LocationJohannesburg, South Africa
Date20 - 23 Apr, 2026
LanguageEnglish

Asia Start: AI + Digital China Expedition
Asia Start provides entrepreneurs and executives with unparalleled access to Asia’s dynamic digital economy and its business ecosystems, offering the latest trends and insights, strategies, and connections to overcome challenges and unlock future growth for your business in Asia and beyond.
LocationChina (Shanghai, Hangzhou, Shenzhen)
Date11 - 14 May, 2026
LanguageEnglish

Scaling Innovation: AI and Digital Strategies for Business Transformation
Global Unicorn Program Series
In partnership with Columbia Engineering
This program is designed to equip senior executives with the strategic insights and tools necessary to lead in this transformative era.
LocationNew York, USA
Date27 Sep - 02 Oct, 2026
LanguageEnglish

Emerging Tech Management Week: Silicon Valley
Global Unicorn Program Series
In partnership with UC Berkeley College of Engineering
This program equips participants with proven strategies, cutting-edge research, and the best-in-class advice to fuel innovation, seize emerging tech developments, and catalyse transformation within your organization.
LocationUC Berkeley
Date01 - 06 Nov, 2026
LanguageEnglish

Stanford & Silicon Valley Immersion Program
Global Unicorn Program Series
In partnership with Stanford Engineering Center for Global & Online Education
This CKGSB program equips entrepreneurs, intrapreneurs and key stakeholders with the tools, insights, and skills necessary to lead a new generation of unicorn companies.
LocationStanford University Campus,
California, United States
Date06 - 11 Dec, 2026
LanguageEnglish with Chinese Translation