Against the backdrop of economic globalization, trade frictions among major countries are not only likely to intensify multi-party tariff confrontations, but also may push mutually beneficial, free and fair international trade to the edge of a cliff. Chinese enterprises going overseas not only have to deal with the risks of trade friction but also the challenge of ‘industrial hollowing out.’ How China’s businesses respond to the ‘new normal’ will show how resilient and competitive Chinese foreign trade can be, but the question remains of how China can adjust its foreign trade strategy, diversify trade risks and expand into new market spaces.
In June 2024, the US Treasury Department issued a Notice of Proposed Rulemaking (NPRM). The 165-page draft seeks to limit investment in China by US entities in three high-tech areas, namely semiconductors and microelectronics, quantum information technology and artificial intelligence. This draft came a month after the US announced the results of its review of the 301 existing tariffs imposed on China, deciding to impose additional tariffs on new energy, semiconductors and key minerals, thus triggering a renewed focus on trade as well as tariffs.
After the outbreak of the trade war between China and the US in 2018, tariffs between the two countries rose and trade barriers increased, and the volume of direct trade between China and the United States decreased. China has since attempted to adjust its foreign trade strategy and taken a variety of measures to alleviate the pressure brought about by the tensions. One such strategy has been to adjust its trade structure by strengthening cooperation with other countries and neighboring regions, reducing its dependence on the US and diversifying its trade risks through expansion into new markets.
This change has been reflected in the decline in China’s direct trade with the US and its declining trade position with other major partners such as Europe, Japan and South Korea. At the same time, China’s trade with emerging economies such as ASEAN, in particular Vietnam and Mexico, has increased in relative terms. China has also increased direct investment into these emerging economies to reduce its dependence on any single market.
The difficulties posed by the trade tensions have meant that it has been difficult for China’s trade to grow as quickly as it had done before. And while going overseas is not the panacea it was, thanks to the increased exposure to trade frictions, as many Chinese enterprises are still seeking out new markets, it is important to also highlight the risks of a hollowing out of Chinese industry.
Structural changes in foreign trade
There are clear changes in the trends of China’s foreign trade before and after the trade war began in 2018. In 2017, the US made up 14.27% of China’s total foreign trade, but this has since decreased to 10.7% in the first five months of 2024. Over the same period, trade with the EU, Japan and South Korea decreased by 2.30%, 2.33%, and 1.50%, respectively. Meanwhile, the shares of ASEAN, Vietnam, Russia and Mexico all increased by 3.27%, 1.17%, 1.85%, and 0.21%, respectively.
In other words, compared with 2017, the share of developed economies such as the US, Europe, Japan and South Korea in China’s foreign trade has declined, while the share of emerging economies such as Vietnam and Mexico rose steadily. In 2020, ASEAN overtook the EU as China’s largest trading partner.
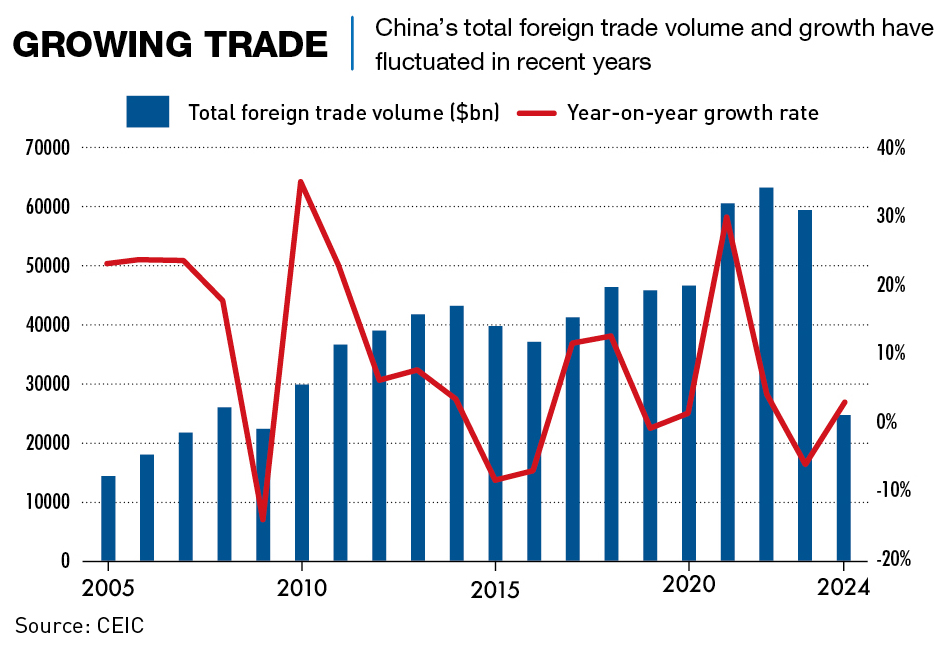
China’s trade as a whole has fluctuated since 2018, but has generally held an upward trend. In 2019, total trade declined by almost 1% due to the impacts of trade restrictions. The outbreak of the pandemic in 2020 compounded this with a global decline in trade as countries shut down to varying degrees in an attempt to deal with the impacts of COVID-19.
In 2021 and 2022, China had better control of the pandemic, and thanks to its relatively complete supply chain, as well as other countries still struggling to bounce back from lockdowns, China’s export scale massively increased—29.81% year-on-year in 2021, and a further 4.4% y-o-y from that high base in 2022. In 2023, however, China’s total trade declined by 5.91% y-o-y due to a decline in overall global trade and increasing trade frictions, it fell to just below the 2021 level, but was still a 44.55% increase compared to 2017. Up to May 2024, total trade has amounted to $2.46 trillion, an increase of 2.77% y-o-y.

China-US trade declines
Between 2012 and 2022, the US was the largest destination for China’s exports, with exports to the US accounting for 18.99% of the total in 2017. After an increase in 2018 due to manufacturers trying to beat the impending implementation of tariffs, exports to the US have been steadily declining year by year.
From 2017 to 2024, the shares of the US, the EU, Japan and South Korea decreased by 5.00%, 1.81%, 1.64%, and 0.26%, respectively, while the shares of ASEAN, Vietnam, Russia, and Mexico increased by 4.47%, 1.47%, 1.09%, and 0.41%, respectively. Since 2023, ASEAN has been the largest export destination for China, overtaking the US.
China’s foreign trade balance has gone through two distinct rounds of decline followed by a rise. The trade surplus fell to a near-decade low in 2018, but it grew by 20% year-on-year in 2019, the same as it did in 2017 before the trade war broke out. China’s trade surplus rose every year for the three years of the pandemic, reaching a record $837.928 billion in 2022. The trade surplus also remains relatively high in 2023 and 2024, although it has declined slightly year-on-year.
The United States, Hong Kong, China, the European Union and ASEAN are the top sources of China’s trade surplus, with China’s trade surplus with Mexico and ASEAN gradually increasing.
Between 2017 to 2023, China’s share of trade with the US decreased by 5.07%, while the EU, Mexico, Vietnam, South Korea, and Canada increased their share. China was the US’ largest trading partner from 2015 to 2018, but the EU replaced China in 2019. Since then, both Mexico and Canada have also overtaken China, and the country now sits in fourth place, where it is expected to stay for some time, given its lead over fifth place South Korea.
China, the EU, Mexico and Vietnam are the main sources of the US trade deficit. From 2018 to 2023, the US trade deficit with China narrowed from $418.2 billion to $279.4 billion, while the trade deficit with the EU, Mexico, and Vietnam grew.
Additionally, the re-export trade from China to ASEAN and Mexico, and from ASEAN and Mexico to the US is trending upwards.
Chinese firms going global
In terms of outward direct investment, Chinese enterprises are accelerating their presence in Southeast Asia, especially in Vietnam. The US-China tensions and the pandemic have strengthened the trend of foreign investment flows into Vietnam and Mexico, in particular, for a number of reasons. These include actions to reduce production costs, improve product quality and expand into overseas markets, bolster a diversified layout within the global supply chain, circumvent US tariffs and trade barriers and improve overall risk-resistant capacity.
Even prior to 2018, China’s direct investment into Vietnam was increasing year by year, from $427 million in 2014 to $2.465 billion in 2018. It then increased to $4.063 billion in 2019, before declining during the pandemic and returning to growth in 2023.
In terms of Mexico’s FDI data, the US accounts for 40% and China only accounts for about 1%, but China has now become the fastest-growing source of foreign investment in Mexico. In 2018, China’s direct investment into the country doubled from the previous year, and grew to reach a single-year high of $570 million in 2022. China is now the fourth largest source of foreign direct investment in Mexico.

Conclusion
Overall, in the context of the US-China trade war, China’s trade with the US, Europe, Japan and South Korea and other major economies has gradually declined in China’s share of foreign trade, while the share of China’s trade with ASEAN, Mexico and other emerging economies is gradually increasing.
In order to cope with the trade war, China has attempted to circumvent trade barriers as well as encourage Chinese enterprises to go abroad and make direct investments and build factories overseas.
As Chinese companies go overseas, the risk of ‘industrial hollowing out’ in China is a cause for alarm. In recent years, China’s manufacturing value-added as a percentage of GDP has been on the decline: in 2006, the share of manufacturing value-added as a percentage of GDP peaked at 32.5%, and hovered at a high level for the next five years, subsequently declining year by year from 2011 to 26.3% in 2020, a significant drop of 5.8% in nine years. Although this share rebounded to 27.7% in 2022, it is still at a multi-year low.
Compared with the US, Germany, Japan and other major global industrial countries at the same stage of development, the share of manufacturing in China has declined earlier and faster, which could trigger the ‘hollowing out’ of industries, weakening the resilience of China’s economy to risks and its international competitiveness.
Ouyang Hui, Distinguished Dean’s Chair Professor of Finance, CKGSB and Dongyan Ye, Research Fellow, CKGSB


