Although official data for first-quarter GDP and industrial growth exceeded expectations, the industrial economy has not yet bottomed out.
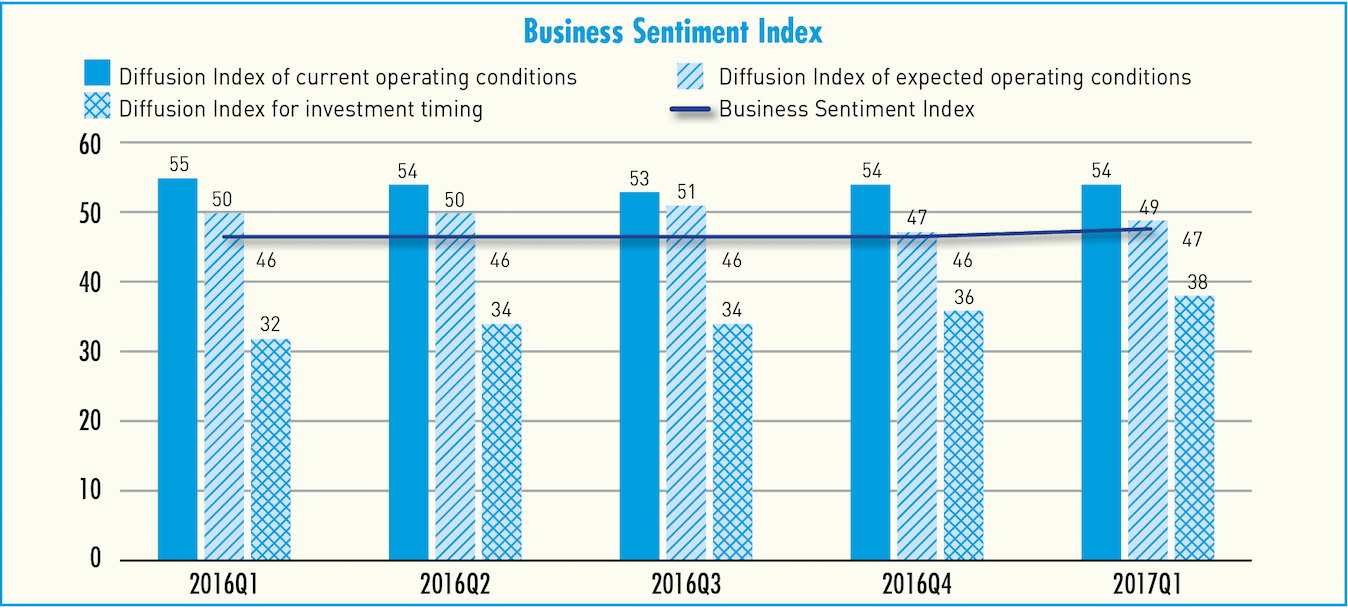
Our Business Sentiment Index in the first quarter stood at 47, one point above the previous quarter, but still indicating a slight contraction. Overcapacity remains at a historical high, both in terms of its prevalence and severity.
The low BSI in Q1 was, again, a result of weak investment. Only 1% of the firms considered it a “good” time to make fixed investments, with a diffusion index of 38, far below the turning point of 50. In reality, only 8% of firms made any fixed investments in Q1 and a mere 2% made expansionary investments. The sluggish investment is not likely to improve in the near future: only 12 firms (0.6 %) said they planned to make investments in the next quarter.
The BSI, directed by Gan Jie, Professor of Finance at the Cheung Kong Graduate School of Business, is the simple average of three diffusion indices, including current operating conditions, expected change in operating conditions and investment timing. The index ranges between 0 and 100—a larger value indicates better operating conditions, with 50 marking the turning point between expansion and contraction. Compared with other economic indices, the BSI is more forward-looking and is a reflection of the absolute level of economic activities.
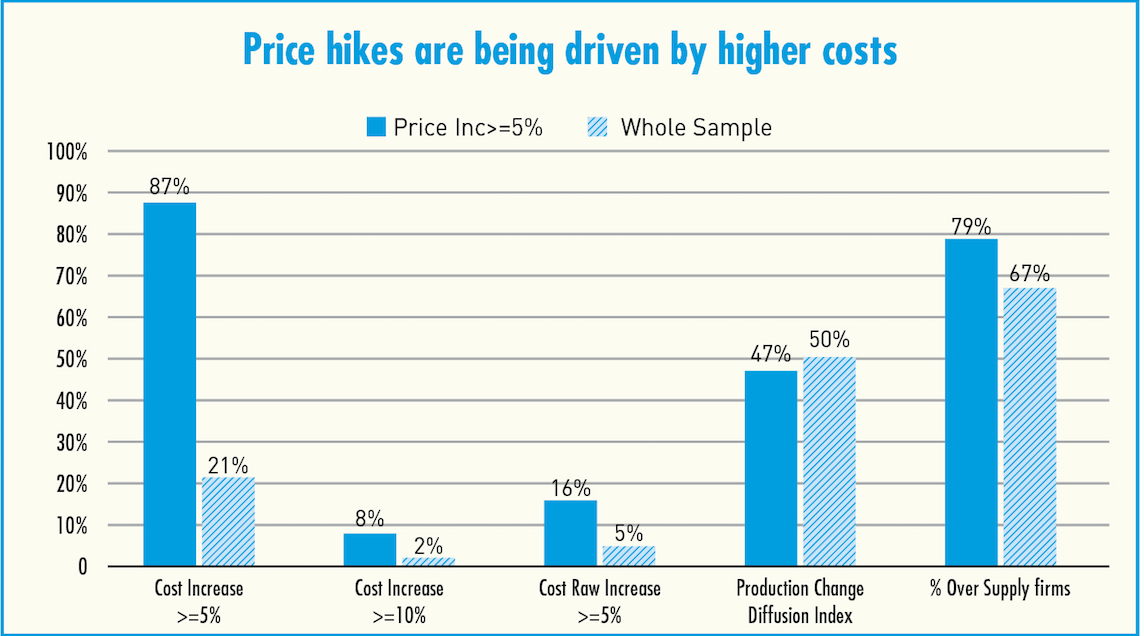
As in 2016 Q4, cost rises have been the driving force behind price rises. Among firms with product costs inflation above 5%, cost rises were the most prominent. The proportion of firms with unit cost increases above 5% and 10% were 87% and 8%, respectively, far above the whole sample. Unit cost increases are mostly related to raw materials costs—16% of these firms reported raw materials cost rises above 5%. Meanwhile, these firms were similar to the whole sample in terms of production expansion and overcapacity. This points toward price inflation driven by cost run-ups, rather than by increased demand.
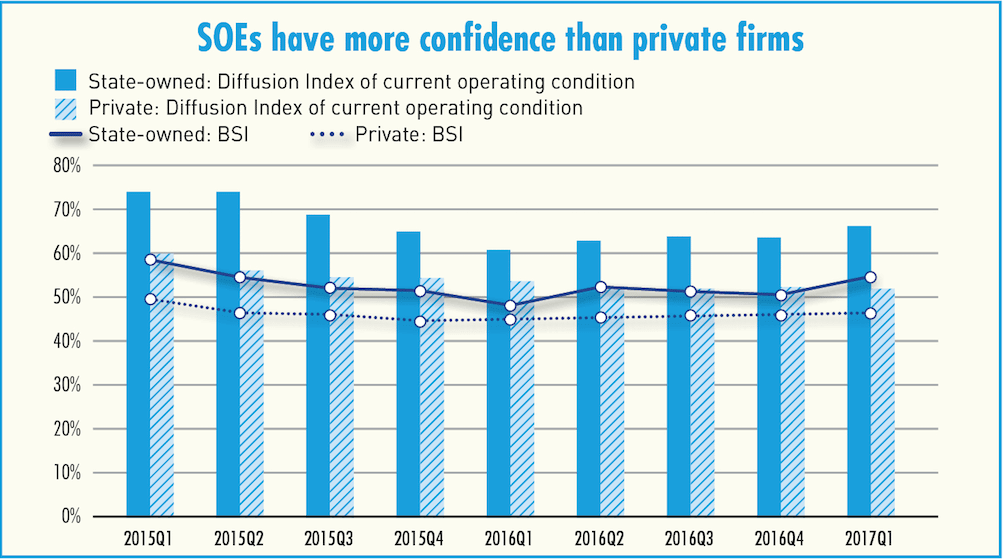
The advantage of state-owned firms over private firms has increased in recent quarters, in terms of business sentiment and operating conditions. After two years of capacity curtailment, state-owned firms fared better in production and investment in Q1, as compared with private firms. This chart also suggests that the recent media reports of export expansion in Q1 have been due to the fact that exports of state-owned firms dropped in the past year before recovering significantly in Q1. As for private firms, their exports did not shrink last year and stayed flat in Q1. Private firms represent the vast majority, with overall exports staying flat in Q1.
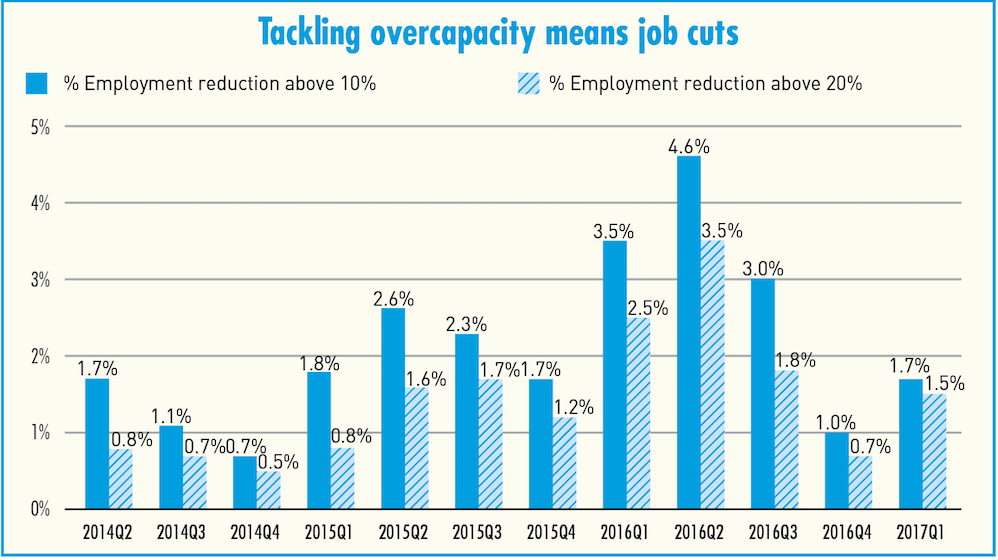
In Q1, the proportion of firms reducing workers by more than 10% was 1.7%, while the proportion of firms reducing workers by more than 20% was 1.5%, up from 1.0% and 0.7% in Q4. We estimate that a total of 650,000 jobs were lost in 2017 Q1. Consistent with an improved industrial structure, firms with severe overcapacity are more likely to reduce employment and production. Among those with severe overcapacity (above 20%), the proportion of firms reducing production by more than 5% and 10% were 26% and 17% respectively, both significantly more than that of the whole sample (10% and 5%).


